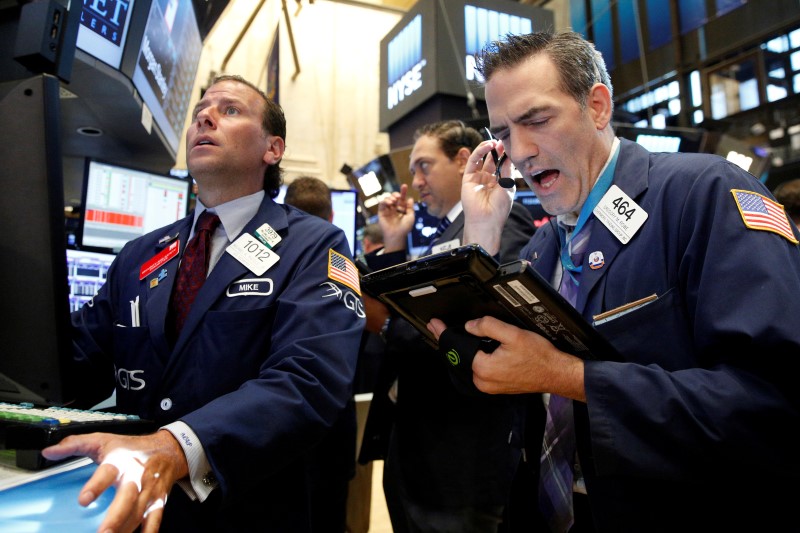
NEW YORK (Reuters) - Wall Street rose on Friday, with the S&P 500 index hitting a record intraday high for the seventh time this month as gains in technology heavyweights Alphabet and Amazon more than made up for losses in energy shares.
The benchmark index rose as much as 0.3 percent, touching an all-time high of 2,177.09, and completed its fifth straight month of gains.
Shares of Google parent Alphabet (O:GOOGL) jumped 3.33 percent a day after the Internet company posted strong quarterly revenue growth, while online retailer Amazon.com (O:AMZN) touched a record high after giving an upbeat forecast for the current quarter.
Alphabet contributed the most to gains on the Nasdaq and the S&P 500.
However, the Dow was dragged down by a 1.48 percent drop in McDonald's (N:MCD) and a 1.39 percent fall in Exxon (N:XOM), which reported a lower-than-expected quarterly profit. The stock was the top percentage loser on that index.
Aggregate second-quarter earnings of S&P 500 companies are now expected to fall 3.7 percent, worse than a 2.8 percent decline predicted on Thursday, according to Thomson Reuters I/B/E/S.
U.S. gross domestic product in the second quarter grew at a 1.2 percent rate, coming in below expectations for a rise of 2.6 percent and fueling arguments the Federal Reserve may not need to raise U.S. interest rates anytime soon.
"Investors are still willing to play chicken with the Fed, thus the S&P 500 has hit a new intraday all-time high," said Sam Stovall, U.S. equity strategist at S&P Global Market Intelligence in New York.
The Dow Jones industrial average (DJI) ended down 0.13 percent at 18,432.24 while the S&P 500 (SPX) gained 0.16 percent to 2,173.6.
The Nasdaq Composite (IXIC) added 0.14 percent to 5,162.13.
For the week, the Dow fell 0.75 percent, the S&P edged down 0.07 percent and the Nasdaq rose 1.2 percent.
In July, the Dow rose 2.8 percent, the S&P climbed 3.6 percent and the Nasdaq surged 6.6 percent.
Volume was strong as investors wrapped up July. About 7.3 billion shares changed hands on U.S. exchanges, above the nearly 6.6 billion daily average over the past 20 sessions.
On Friday, seven of the 10 major S&P 500 indexes were higher, led by a 1.33 percent rise in the telecoms services index (SPLRCL).
Baidu (O:BIDU) dropped 3.64 percent after the Chinese Internet search engine posted its biggest quarterly profit decline since going public. The stock weighed the most on the Nasdaq.
Health insurer Cigna (N:CI) dropped 5.17 percent after reporting a lower-than-expected quarterly profit.
Advancing issues outnumbered declining ones on the NYSE by a 1.68-to-1 ratio; on Nasdaq, a 1.03-to-1 ratio favored advancers.

The S&P 500 posted 41 new 52-week highs and one new low; the Nasdaq Composite recorded 104 new highs and 35 new lows.