By Caroline Valetkevitch
NEW YORK (Reuters) -U.S. stocks jumped on Thursday, with the Nasdaq and S&P 500 each ending more than 2% higher after jobless claims fell more than expected in the latest week, soothing worries the labor market was weakening too quickly.
All the major S&P 500 sectors rose, led by gains in technology and communication services. Small-cap stocks also rallied, with the Russell 2000 index climbing 2.4%.
Among the S&P 500's biggest gainers, shares of Eli Lilly (NYSE:LLY) jumped 9.5% after the drugmaker raised its annual profit forecast, and sales of its popular weight-loss drug Zepbound crossed $1 billion for the first time in a quarter.
Data showed the number of new applications last week for unemployment benefits fell more than expected.
"This was the data point for the week, so it took on added importance," said Paul Nolte, senior wealth advisor and market strategist for Murphy & Sylvest in Elmhurst, Illinois.
"Our reading on this is the labor market continues to be OK... The recession fears at this point are probably a little overblown."
Stocks had sold off sharply after last week's July U.S. jobs report sparked fears of a potential U.S. recession. Traders also cited an unwinding of positions of carry trades, where investors borrow money from economies with low interest rates to fund their bets in high-yielding assets elsewhere.
The Dow Jones Industrial Average rose 683.04 points, or 1.76%, to 39,446.49, the S&P 500 gained 119.81 points, or 2.30%, to 5,319.31 and the Nasdaq Composite added 464.22 points, or 2.87%, to 16,660.02.
The Cboe Volatility index, Wall Street's fear gauge, was down on Thursday.
"Once volatility gets going, it takes a while for it to calm down," said David Lundgren, chief market strategist and portfolio manager at Little Harbor Advisors in Marblehead, Massachusetts.
"The fact that we're up a lot doesn't necessarily mean the lows are in or that we're going straight up from here," he said. "But looking out three months, six months the tendency to experience above-average returns is very high."
The second-quarter earnings season is winding down, but investors are watching final results closely after some disappointments earlier in the reporting period.
Shares of Under Armour (NYSE:UA) surged 19.2% after the sports apparel maker posted a surprise first-quarter profit, benefiting from its efforts to cut inventory and promotions.
Volume on U.S. exchanges was 11.98 billion shares, compared with the 12.60 billion average for the full session over the last 20 trading days.
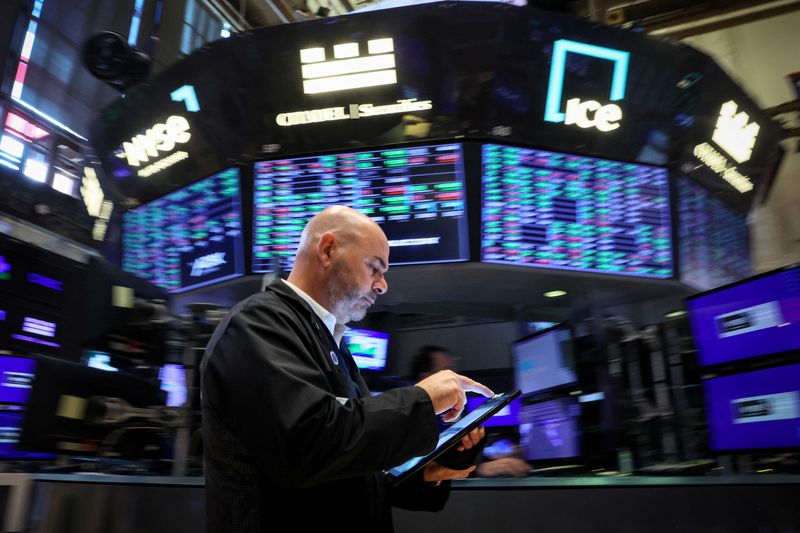
 in New York City, U.S., August 8, 2024. REUTERS/Brendan McDermid")
Advancing issues outnumbered declining ones on the NYSE by a 3.59-to-1 ratio; on Nasdaq, a 2.76-to-1 ratio favored advancers.
The S&P 500 posted 7 new 52-week highs and 4 new lows; the Nasdaq Composite recorded 32 new highs and 183 new lows.