By Caroline Valetkevitch
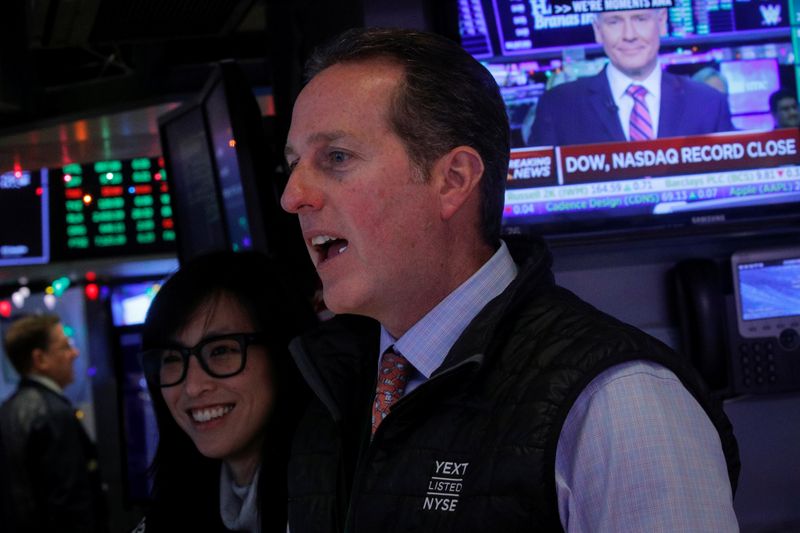
NEW YORK (Reuters) - U.S. stocks hit record closing highs again on Friday and the S&P 500 registered its biggest weekly percentage gain since early September after data showed a rise in consumer spending and investors continued to be optimistic about developments in the U.S.-China trade dispute.
President Donald Trump claimed progress on issues from trade to North Korea and Hong Kong after speaking with Chinese President Xi Jinping, dispelling fears of another escalation in the two countries' trade war.
The S&P 500 also hit a seventh straight intraday all-time high in its longest streak of record intraday highs since October 2017, and the Nasdaq ended with gains for an eighth session in a row.
"This time of year tends to be a tailwind for the market," said Walter Todd, chief investment officer at Greenwood Capital Associates in Greenwood, South Carolina, who helps manage about $950 million.
"There's nothing obvious between now and the end of the year that would change the direction we're headed. So it's kind of a melt-up."
The Dow Jones Industrial Average (DJI) rose 78.13 points, or 0.28%, to 28,455.09, the S&P 500 (SPX) gained 15.85 points, or 0.49%, to 3,221.22 and the Nasdaq Composite (IXIC) added 37.74 points, or 0.42%, to 8,924.96.
The S&P 500 rose for a fourth straight week, gaining 1.7% for the week, its biggest weekly gain since early September.
Consumer spending, a key to U.S. economic growth and a major focus for investors, rose 0.4% in November, adding to a string of upbeat data that have helped put a damper on recession fears, which dogged markets earlier this year.
GRAPHIC: S&P 500 Records - https://fingfx.thomsonreuters.com/gfx/buzzifr/15/3398/3398/gateway%20(5).jpg
Volume on U.S. exchanges hit the highest in a year, boosted by "quadruple witching," in which investors unwind positions in futures and options contracts before their expiration. About 11.53 billion shares changed hands on Friday.
Nike Inc (N:NKE) was down 1.2% after the world's largest sportswear maker reported lower-than-expected growth in revenue from North America.
Cruise operators were among top percentage gainers in the S&P 500, led by Carnival Corp (N:CCL), which jumped 7.6% after forecasting a 2020 profit largely above estimates.
On the flip side, shares of U.S. Steel Corp (N:X) tumbled 10.8% after the company said it expects a bigger-than-expected fourth-quarter loss.
The recent record run could make it harder for stocks to rally once the next earnings season begins, Todd said, noting that "there could be increased volatility."
Advancing issues outnumbered declining ones on the NYSE by a 1.60-to-1 ratio; on Nasdaq, a 1.39-to-1 ratio favored advancers.

The S&P 500 posted 77 new 52-week highs and no new lows; the Nasdaq Composite recorded 199 new highs and 38 new lows.