By Caroline Valetkevitch
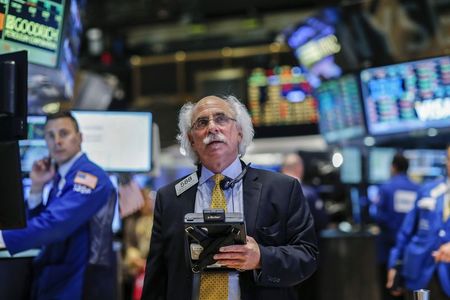
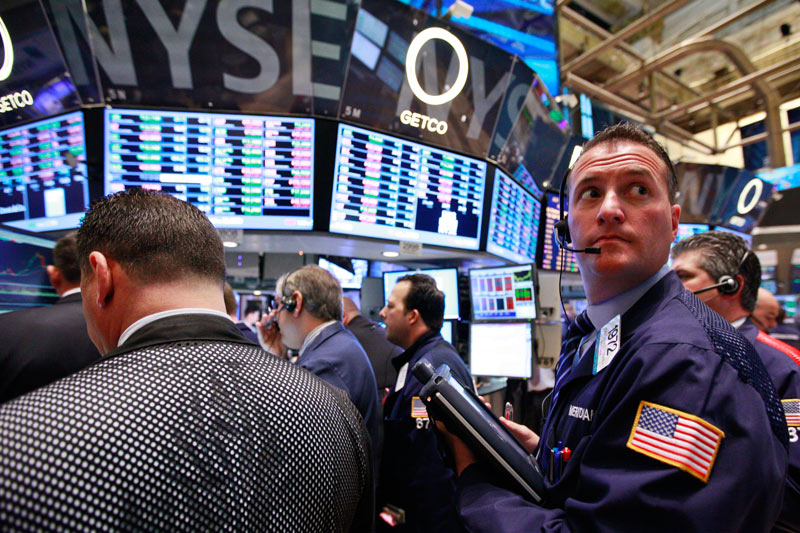
NEW YORK (Reuters) - The S&P 500 and Nasdaq ended up slightly on Tuesday, breaking a three-day string of declines that marked their worst losses since 2011, while the Dow finished lower for a fourth session on lingering worries about global demand.
While the S&P closed in positive territory, it was well off its session highs of more than 1 percent and did little to put investors at ease about the market's recent selloff.
The benchmark index has lost 6.6 percent since its Sept. 18 record closing high and is now up just 1.6 percent for the year, while the Dow is down 1.6 percent since Dec. 31. For a factbox on the market's selloff, see
"Today's action is typical of a market that hasn't completed its downward course," said Peter Cardillo, chief market economist at Rockwell Global Capital in New York.
"In order for this market to escape further declines, we would have to see the market begin to stabilize and not slip in and out of the plus and minus column consistently."
The selloff has been driven by a host of negative influences including the potential spread of Ebola, the effect of global economic weakness on U.S. earnings and plunging oil prices.
The S&P energy index <.SPNY> fell with oil prices, dragging down equities late in the session. The index, which ended 1.2 percent lower for the session, is now down 20.1 percent from its June high, putting it in bear market territory.
Despite some early upbeat corporate results, concerns remain about the effect of a stronger dollar on global demand and U.S. earnings, Cardillo said.
Citigroup (N:C), up 3.1 percent at $51.47, was among the top boosts to the benchmark S&P index after the bank posted better-than-expected quarterly results and said it would pull out of consumer banking in 11 markets.
After the close, shares of Intel (O:INTC) gained 1.4 percent to $32.60 following its results and outlook, which included a rosy fourth-quarter forecast.
The Dow Jones industrial average (DJI) fell 5.88 points, or 0.04 percent, to 16,315.19, the S&P 500 (SPX) gained 2.96 points, or 0.16 percent, to 1,877.7 and the Nasdaq Composite (IXIC) added 13.52 points, or 0.32 percent, to 4,227.17.
Volume has picked up with the volatility in the markets in recent days. About 9.2 billion shares changed hands on U.S. exchanges, above the 8.4 billion average for the last five sessions, according to data from BATS Global Markets.
The largest percentage gainer on the S&P 500 was Delta Air Lines (N:DAL), up 6.1 percent, while the largest percentage decliner was Newfield Exploration (N:NFX), down 5.7 percent.
The largest percentage gainer on the Nasdaq 100 was NXP Semiconductor (O:NXPI), which rose 5.0 percent, while the largest percentage decliner was Gilead (O:GILD), down 4.2 percent.
Among the most active stocks on the NYSE were Brazil's Petrobras (N:PBR), down 0.98 percent to $17.10. Intel was among the most actively traded on the Nasdaq.

Advancing issues outnumbered declining ones on the NYSE by 1,873 to 1,196, for a 1.57-to-1 ratio on the upside; on the Nasdaq, 1,689 issues rose and 1,027 fell.
(Editing by Chizu Nomiyama, Nick Zieminski and Chris Reese)
