Factbox-US stock performance on dates of presidential inaugurations

Published 01/20/2025, 09:03 AM
Updated 01/20/2025, 09:47 AM
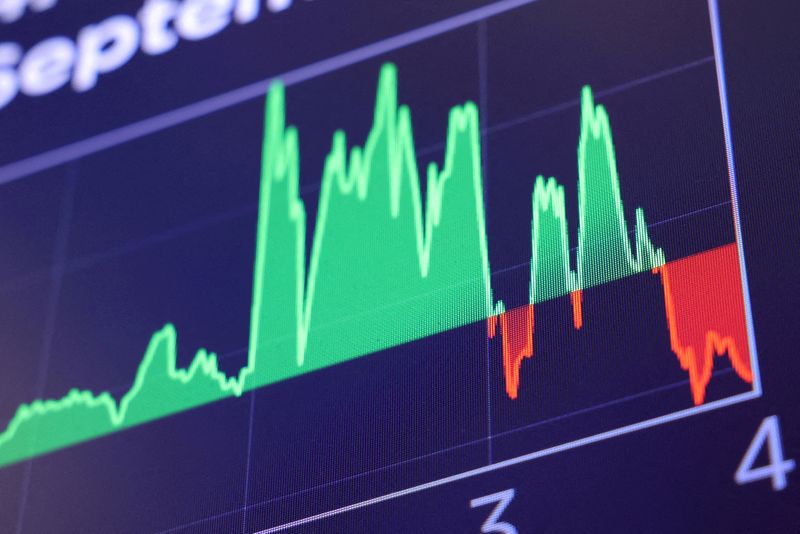
© Reuters. FILE PHOTO: A graph showing the movement of The Dow Jones Industrial Average (DJI) is displayed after the market close at The New York Stock Exchange (NYSE) U.S., September 18, 2024. REUTERS/Andrew Kelly/File Photo
US500
-
DJI
-
IXIC
-

By Saqib Iqbal Ahmed

NEW YORK (Reuters) - Investors will closely monitor stock markets on Tuesday, the day after Donald Trump is inaugurated for his second term in the White House, to see if U.S. equities can continue their recent trend of posting gains after a president is sworn in.

Historically, the benchmark S&P 500 stock index has not performed well on average on inauguration day, or the day after if the inauguration falls on a market holiday. However, the last three inaugurations have all resulted in market gains.

Trump's first inauguration in 2017 was met with a 0.34% gain for the index. The S&P 500 rose 1.39% on the day Joe Biden was sworn in as president, the largest inauguration gain for the index since Ronald Reagan's second inauguration in 1985.

Longer term, the index has logged an average decline of 0.27%, according to data going back to 1949.

For the Dow Jones Industrial Average, the average decline is 0.24%. The Nasdaq Composite, which was launched more recently, has logged an average decline of 0.35%.

The following table shows percentage changes for inaugurations from President Harry Truman on.

President S&P 500 change Nasdaq (%) Dow Jones (%)

(%)

Joe Biden 1.39 1.97 0.83

(1/20/2021)

Donald Trump 0.34 0.28 0.48

(1/20/2017)

Barack Obama 2* 0.44 0.27 0.46

(1/21/2013)

Barack Obama 1 -5.28 -5.79 -4.01

(1/20/2009)

George W Bush 2 -0.78 -1.34 -0.65

(1/20/2005)

George W Bush 0.03 -0.45 -0.09

1* (1/20/2001)

Bill Clinton 2 0.07 1.13 0.16

(1/20/1997)

Bill Clinton 1 -0.4 0.09 -0.43

(1/20/1993)

George HW Bush -0.09 0.15 -0.17

(1/20/1989)

Ronald Reagan 2.28 1.28 2.77

2* (1/20/1985)

Ronald Reagan 1 -2.02 -1.42 -2.09

(1/20/1981)

Jimmy Carter -0.85 na -1.00

(1/20/1977)

Richard Nixon -0.48 na -0.72

2* (1/20/1973)

Richard Nixon 1 -0.33 na -0.46

(1/20/1969)

Lyndon B. -0.035 na -0.11

Johnson

(1/20/1965)

John F. Kennedy 0.32 na 0.31

(1/20/1961)

Dwight D. -0.54 na -0.33

Eisenhower 2*

(1/20/1957)

Dwight D. 0.5 na 0.36

Eisenhower 1**

(1/20/1953)

Harry S. Truman 0.39 na 0.17

(1/20/1949)

Mean -0.27 -0.35 -0.24

Median -0.04 0.15 -0.11

* Market closed, market reaction from first trading day after inauguration.

** The S&P 500 was launched in March 1957, but S&P Dow Jones Indices provides back-tested data for dates that precede its launch
© Reuters. FILE PHOTO: A graph showing the movement of The Dow Jones Industrial Average (DJI) is displayed after the market close at The New York Stock Exchange (NYSE) U.S., September 18, 2024. REUTERS/Andrew Kelly/File Photo

*** Performance for Gerald Ford (NYSE:F), who was sworn in on Aug. 9, 1974, following Nixon's resignation, not included.

**** Performance for initial swearing-in of Lyndon B Johnson, which occurred on Nov. 22, 1963, following Kennedy's death, not included.

Latest comments

Risk Disclosure: Trading in financial instruments and/or cryptocurrencies involves high risks including the risk of losing some, or all, of your investment amount, and may not be suitable for all investors. Prices of cryptocurrencies are extremely volatile and may be affected by external factors such as financial, regulatory or political events. Trading on margin increases the financial risks.
Before deciding to trade in financial instrument or cryptocurrencies you should be fully informed of the risks and costs associated with trading the financial markets, carefully consider your investment objectives, level of experience, and risk appetite, and seek professional advice where needed.
Fusion Media would like to remind you that the data contained in this website is not necessarily real-time nor accurate. The data and prices on the website are not necessarily provided by any market or exchange, but may be provided by market makers, and so prices may not be accurate and may differ from the actual price at any given market, meaning prices are indicative and not appropriate for trading purposes. Fusion Media and any provider of the data contained in this website will not accept liability for any loss or damage as a result of your trading, or your reliance on the information contained within this website.
It is prohibited to use, store, reproduce, display, modify, transmit or distribute the data contained in this website without the explicit prior written permission of Fusion Media and/or the data provider. All intellectual property rights are reserved by the providers and/or the exchange providing the data contained in this website.
Fusion Media may be compensated by the advertisers that appear on the website, based on your interaction with the advertisements or advertisers.
© 2007-2025 - Fusion Media Limited. All Rights Reserved.