The U.S. President-elect, Donald Trump will be holding his first official press conference at 1500 GMT today, since winning the elections in November last year. Investors will be closely watching the event on hopes of further details on the proposed fiscal stimulus plans. The market sentiment remains upbeat but cautious. The U.S. equity markets were mixed yesterday with the Dow Jones closing 0.16% lower while the S&P 500 Index was flat, leaving only the Nasdaq to post modest gains of 0.36% on the day. Besides Trump's presser, Fed Chair Janet Yellen's speech will also be coming up later during the week. The U.S. dollar index remains trading near the price level of 101.70 - 101.50 which is currently holding up as support after the price level previously gave way as resistance as the U.S. dollar rallied toward 103.50 levels.
EUR/USD intra-daily analysis

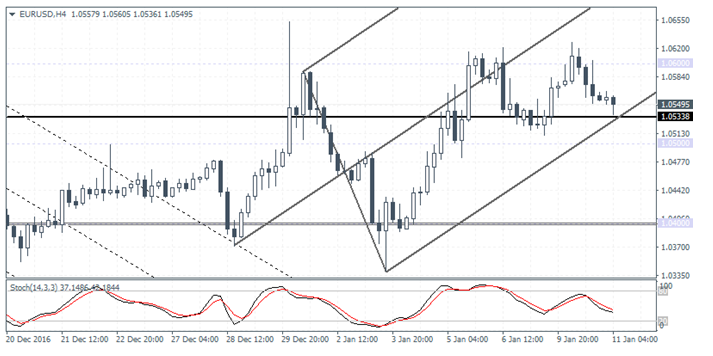
EUR/USD (1.0549):EUR/USD remains caught within the 1.0600 - 1.0500 range that has been established over the past five daily sessions. Price action is likely to slip back to 1.0500 support in the near term with further bias likely to be established on a breakout from 1.0600 or 1.0500. To the upside, 1.0700 will be the next resistance level of interest that will be targeted, provided the single currency will establish support near 1.0533. To the downside, a break below 1.0533 support could send EUR/USD to test 1.0500 support, which if fails could signal further downside in EUR/USD towards 1.0400.
GBP/USD intra-dayanalysis

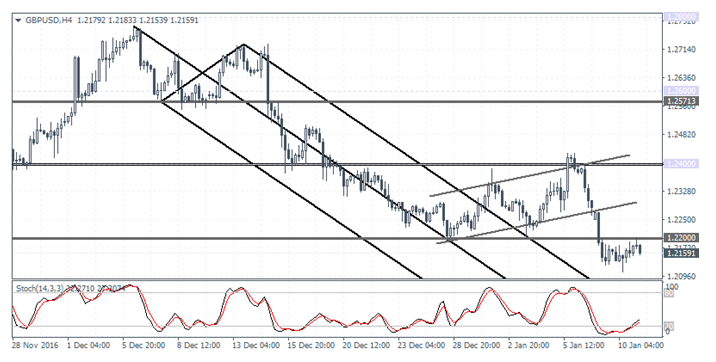
GBP/USD (1.2159): GBP/USD closed with a potential reversal pattern that could see some near-term upside on a bullish follow through today. The price fell to lows of 1.2107 yesterday before recovering from the intraday lows to close at 1.2177. Price action on the 4-hour chart shows the bearish flag pattern that has formed and could signal further downside in the near term with the first support at 1.2040 likely to be tested on a bearish continuation to the downside. The bearish bias could change view only on a daily bullish close above 1.2200.
XAU/USD intra-day analysis

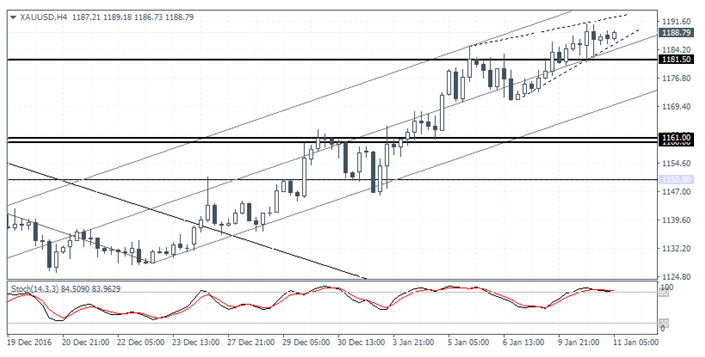
XAU/USD (1188.79): Gold prices are posting a steady gain to the upside with yesterday's bullish close putting the price of the precious metal within reach of a few dollars from targeting the $1200.00 resistance level. The daily Stochastics oscillator is now showing a hidden bearish divergence and could signal a near-term correction after gold prices hit the $1200.00 mark. On the 4-hour chart, gold prices are showing the potential risk of a short term correction towards 1181.50 with a larger correction likely if price breaks below this level on the currently evolving rising wedge pattern.
