Global equity indexes outside the US were mixed yesterday, and the big three US indexes were uniformly negative. The NASDAQ finished fractionally lower at -0.5%, while the Dow and S&P 500 settled at bit lower at -0.31% and -0.30%, respectively.
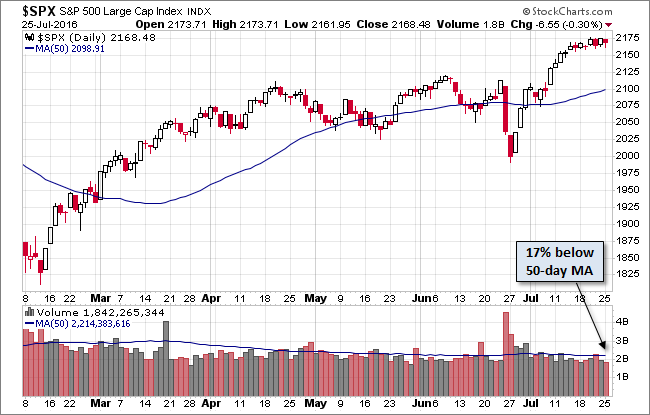
Our benchmark 500 opened lower and sold off to its -0.60% intraday low during the lunch hour. It then struggled higher in a couple of waves to half its loss at -0.30%. The popular financial press pointed fingers at oil for the weak session. West Texas Intermediate Crude fell 2.40% to its lowest close in exactly three months.
The yield on the 10-Year closed at 1.58%, up one basis point from the previous session.
Here is a daily chart of the index. Trading volume was summertime light.
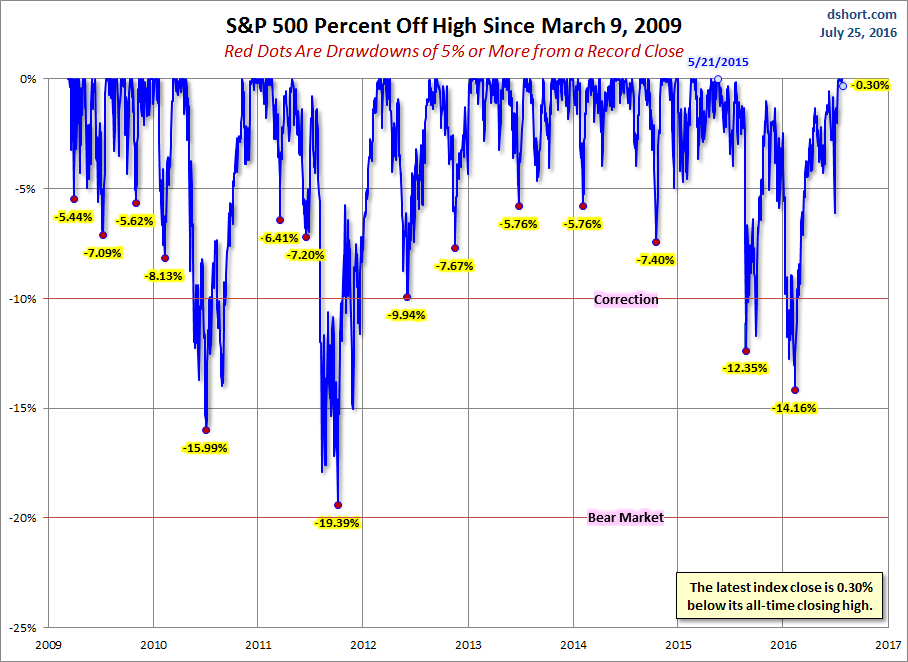
A Perspective on Drawdowns
Here's a snapshot of selloffs since the 2009 trough.
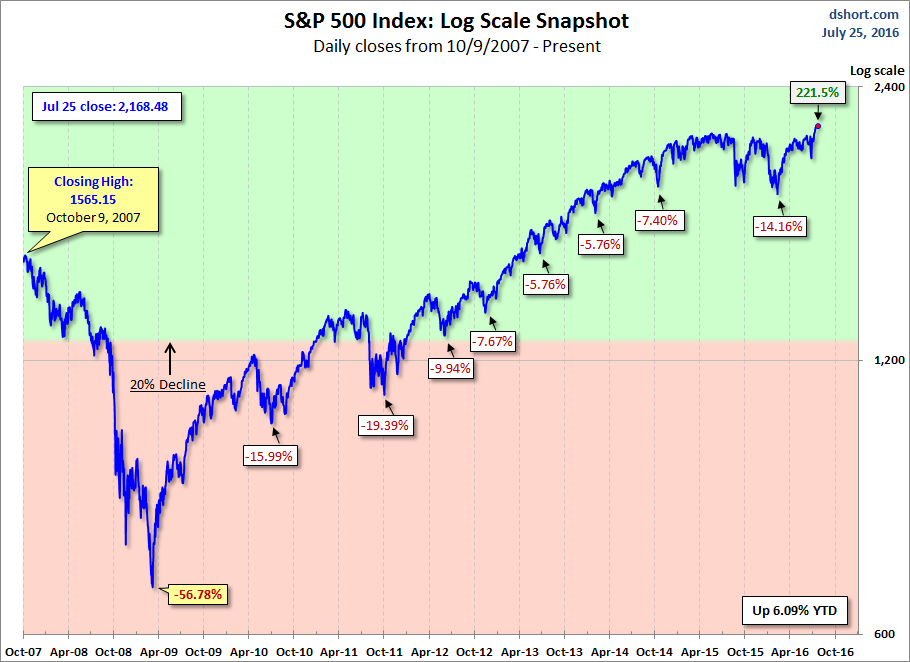
Here is a more conventional log-scale chart with drawdowns highlighted.
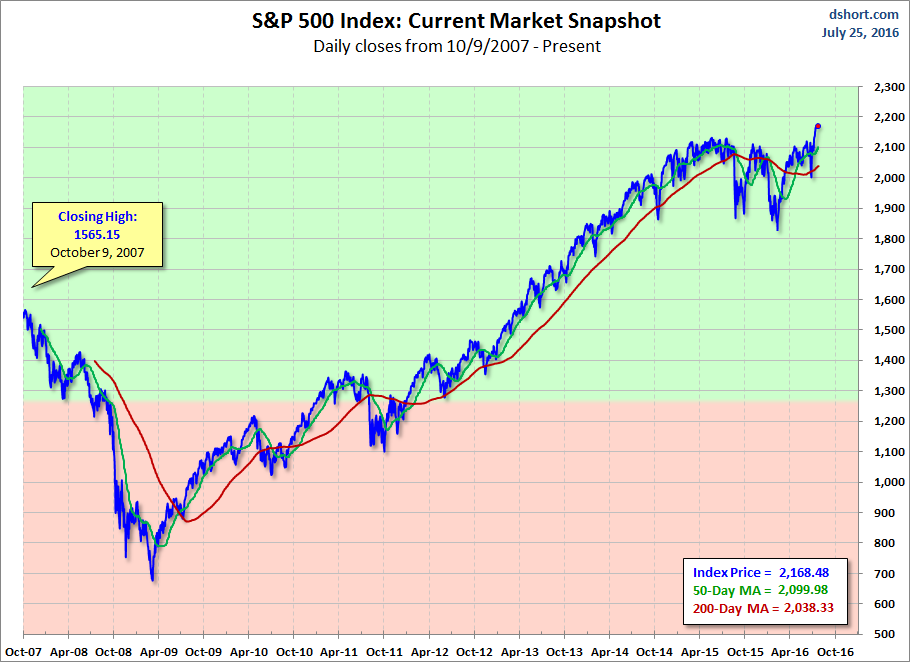
Here is a linear scale version of the same chart with the 50- and 200-day moving averages.
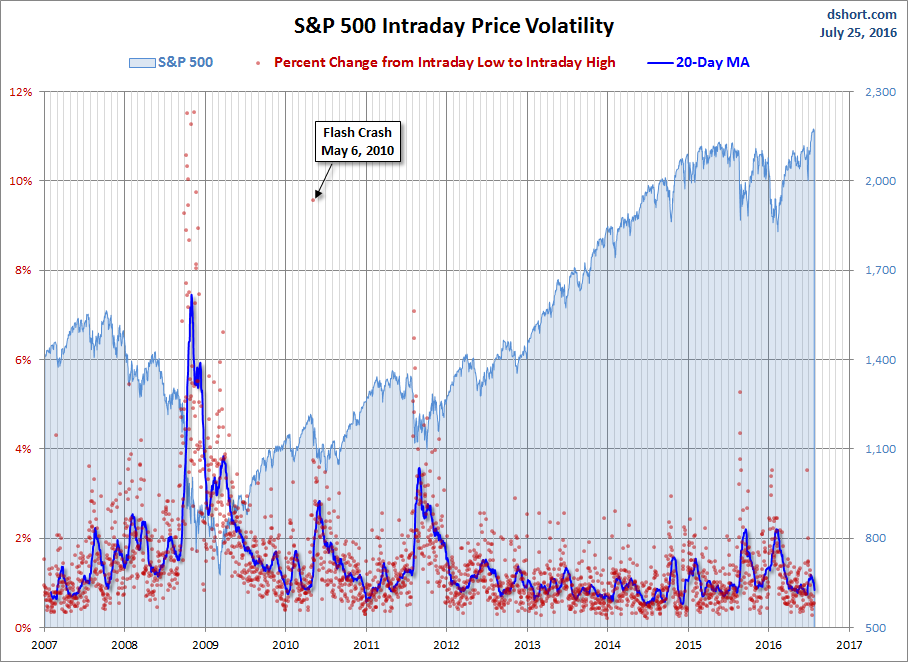
A Perspective on Volatility
For a sense of the correlation between the closing price and intraday volatility, the chart below overlays the S&P 500 since 2007 with the intraday price range. We've also included a 20-day moving average to help identify trends in volatility.

