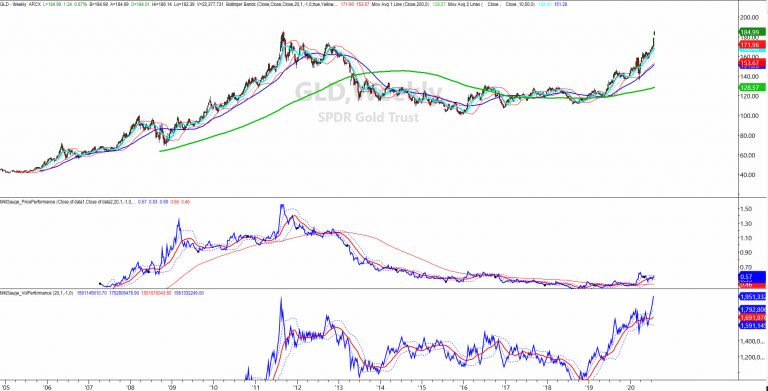
MarketGauge has some pretty cool proprietary software. One indicator is Triple Play. That measures the ratio between a particular instrument and a benchmark.
Triple Play reveals the true trend strength of a market based on "price leadership" and "volume power". This measure of the market's health gives you an advantage that other traders don't have.
For example, many are calling for a top in gold. Others have already taken profits and are out now in the position where they must chase to reenter.
While others are using relative strength to reason that gold is overbought and must correct. The Triple Play indicator shows us that gold will continue to trend.
Here’s why.
First, a word about Junk bonds.
In the last daily I mention that SPDR® Bloomberg Barclays (LON:BARC) High Yield Bond ETF (NYSE:JNK) is a great way to time the market. If JNK breaks the 200-WMA, then perhaps we can confidently say the move up is over.
However, as of yesterday, JNK has moved up further ,thereby signaling no end in sight to risk appetite.
Regardless, gold has something else to say entirely.
Have a look at the middle box of the chart.
That shows the ratio between the S&P 500 and Gold.
In 2011, gold reached a price of $2000.
The ratio between SPDR S&P 500 (NYSE:SPY) and SPDR® Gold Shares (NYSE:GLD) was at 1.57.
Yesterday, with gold trading at or around $2000, that same ratio is at .57.
One-third of where it was in 2011.
What could that mean?
It could mean that gold is still well-undervalued relative to SPY and the ratio can double or triple from here before we hit 2011 levels.
Think about that top pickers!
Key Levels
S&P 500 (SPY) 323 now pivotal support if good
Russell 2000 (iShares Russell 2000 ETF (NYSE:IWM)) Cleared the 200-WMA and now has 150 resistance
Dow (SPDR® Dow Jones Industrial Average ETF Trust (NYSE:DIA)) 270 now resistance 262.50 support
NASDAQ (Invesco QQQ Trust (NASDAQ:QQQ)) 262 resistance with support at 250
SPDR® S&P Regional Banking ETF (NYSE:KRE) Unconfirmed recuperation phase. 38.31 must hold to confirm
VanEck Vectors Semiconductor ETF (NYSE:SMH) 165-168 resistance 160 support
iShares Transportation Average ETF (NYSE:IYT) Back to an unconfirmed accumulation phase-. 172.55 must hold
iShares Nasdaq Biotechnology ETF (NASDAQ:IBB) 142 resistance 136 support
SPDR® S&P Retail ETF (NYSE:XRT) New 2020 highs today
Volatility Index (iPath® Series B S&P 500® VIX Short-Term Futures™ ETN (NYSE:VXX)) Not a new low but maybe a double bottom-27.75 major support along with an inside day
Junk Bonds (JNK) Risk appetite on
(LQD) (iShs iBoxx High yield Bonds) 137.50 support
