One of the best pieces of advice I ever got was this: “Don’t tell the market what it’s supposed to do, let the market tell you what you’re supposed to do.”
That is profound. And it really makes me wish I could remember the name of the guy who said it. Sorry dude. Anyway, whoever and wherever you are, thank you Sir.
Think about it for a moment. Consider all the “forecasts”, “predictions” and “guides” to “what is next for the stock market” that you have heard during the time that you’ve followed the financial markets. Now consider how many of those actually turned out to be correct. Chances are the percentage is fairly low.
So how do you “let the market tell you what to do?” Well, like everything else, there are lots of different ways to do it. Let’s consider a small sampling.
Basic Trend-Following
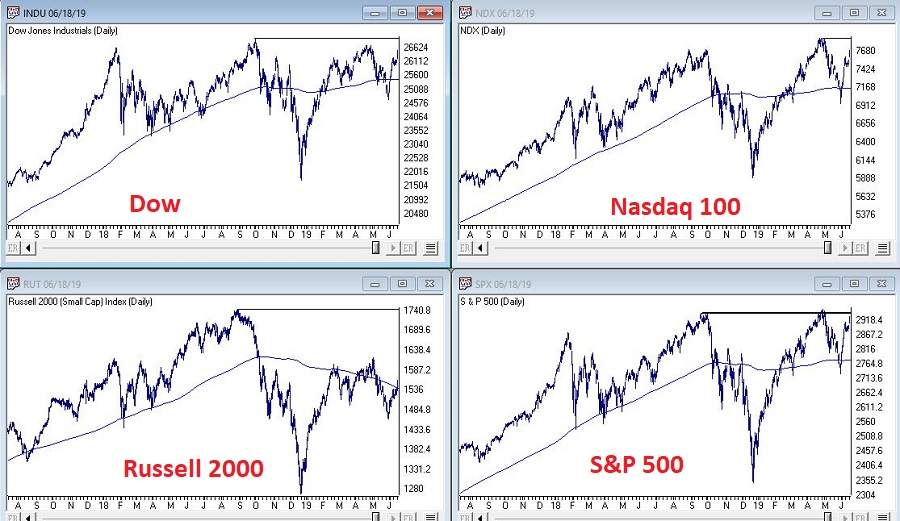
Figure 1 displays the Dow Jones Industrials, the Nasdaq 100, the S&P 500 and the Russell 2000 clockwise form the upper left. Each displays a 200-day moving average and an overhead resistance point.

Figure 1: Courtesy AIQ TradingExpert
The goal is to move back above the resistance points and extend the bull market. But the real key is for them to remain in an “uptrend”, i.e.,:
*Price above 200-day MA = GOOD
*Price below 200-day MA = BAD
Here is the tricky part. As you can see, a simple cross of the 200-day moving average for any index may or may not be a harbinger of trouble. That is, there is nothing “magic” about any moving average. In a perfect world we would state that: “A warning sign occurs when the majority of indexes drop below their respective 200-day moving average.”
Yet in both October 2018 and May 2019 all four indexes dropped below their MA’s and still the world did not fall apart, and we did not plunge into a major bear market. And as we sit, all four indexes are now back above their MA’s. So, what’s the moral of the story? Simple – two things:
- The fact remains that major bear markets (i.e., the 1 to 3 year -30% or more variety) unfold with all the major averages below their 200-day moving averages. So, it is important to continue to pay attention.
- Whipsaws are a fact of life when it comes to moving averages.
The problem then is that #2 causes a lot of investors to forget or simply dismiss #1.
Here is my advice: Don’t be one of those people. While a drop below a specific moving average by most or all the indexes may not mean “SELL EVERYTHING” now, it will ultimately mean “SEEK SHELTER” eventually as the next major bear market unfolds. That is not a “prediction”, that is simply math.
The Bellwethers
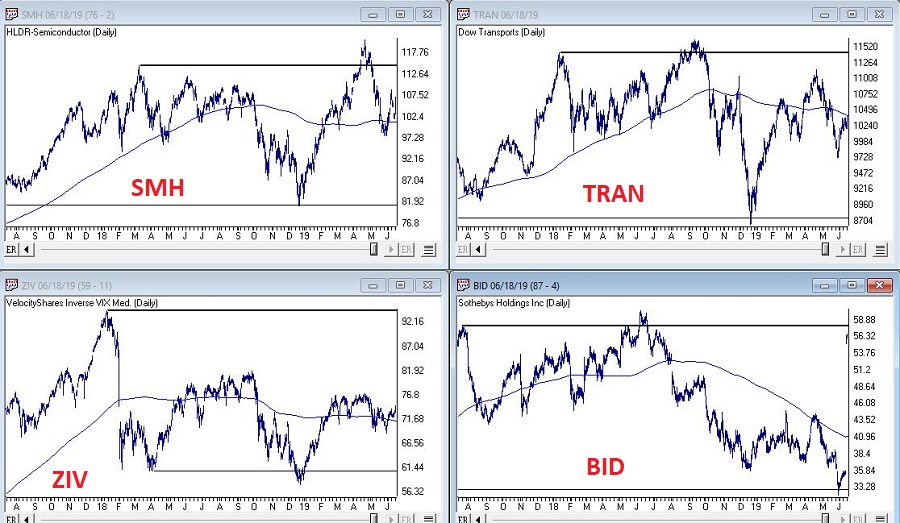
I have written in the past about several tickers that I like to track for “clues” about the overall market. Once again, nothing “magic” about these tickers, but they do have a history of topping out before the major averages prior to bear markets. So, what are they saying? See Figure 2.

Figure 2: Courtesy AIQ TradingExpert
The bellwethers don’t look great overall.
VanEck Vectors Semiconductor ETF (NYSE:SMH) (semiconductor ETF): Experienced a false breakout to new highs in April, then plunged. Typically, not a good sign, but it has stabilized for now and is now back above its 200-day MA.
Dow Transports: On a “classic” technical analysis basis, this is an “ugly chart.” Major overhead resistance, not even an attempt to test that resistance since the top last September and price currently below the 200-day MA.
VelocityShares Daily Inverse VIX Medium Term (NASDAQ:ZIV) (inverse VIX ETF): Well below it’s all-time high (albeit well above its key support level), slightly above it’s 200-day MA and sort of seems to be trapped in a range. Doesn’t necessarily scream “SELL”, but the point is it is not suggesting bullish things for the market at the moment.
Sotheby’s (NYSE:BID) (Sotheby’s – which holds high-end auctions): Just ugly until a buyout offer just appeared. Looks like this bellwether will be going away.
No one should take any action based solely on the action of these bellwethers. But the main thing to note is that these “key” (at least in my market-addled mind) things is that they are intended to be a “look behind the curtain”:
*If the bellwethers are exuding strength overall = GOOD
*If the bellwethers are not exuding strength overall = BAD (or at least not “GOOD”)
A Longer-Term Trend-Following Method
In this article I detailed a longer-term trend-following method that was inspired by an article written by famed investor and Forbes columnist Ken Fisher. The gist is that a top is not formed until the S&P 500 Index goes three calendar months without making a new high. It made a new high in May, so the earliest this method could trigger an “alert” would be the end of August (assuming the S&P 500 Index does NOT trade above it’s May high in the interim.
