It has been a very long time since the Dow Jones, S&P 500 and the Nasdaq 100 experience such a sharp sell off. In a matter of days, the major indexes have erased all the gains it made in 2018. The Dow has lost a staggering 3351 points, the S&P 500 has lost 313 points and the Nasdaq 100 has lost 669 points.
It is true that the markets often fall faster then it rises. We have now entered into correction territory for the major indices. Will this correction turn full bloom into a crash? When will the panic selling in the stock market end? In times like these, price action will be able to tell you what to expect. If you rely solely on emotions, then we will always buy near the top and sell near the bottom. Astute investors and traders are guided by sound analysis rather than feelings.
In order to put things into perspective, we need to look at the price action and what it is telling us. Whenever there is a big sell off in the markets, we have to look for strong areas of support to anticipate where the sell off will likely end.
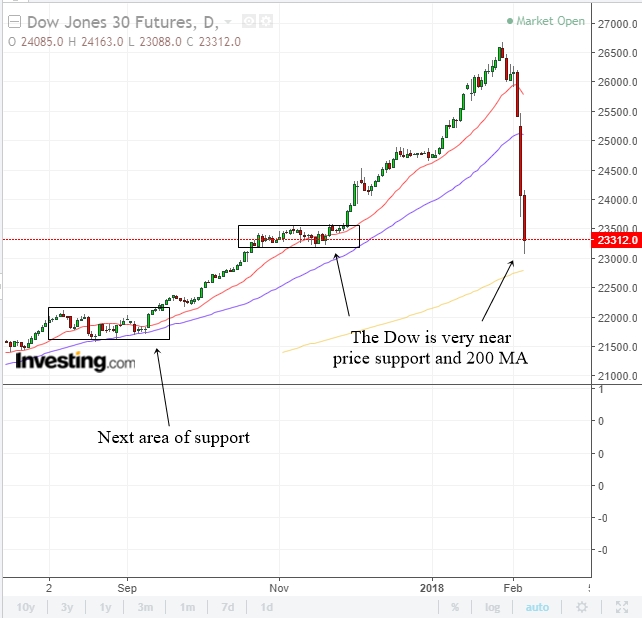
The chart above shows the daily chart of the Dow Futures. As you can see, the index is dropping to an area of important price support. This is also where it will meet the rising 200 MA. The 200 MA is a very important psychological support that is watched by many investors. When there is price support and the 200 MA nearby, usually you can expect a bounce up.
Is this the time to go in and buy stocks? One needs to be really careful when trying to bottom fish. Otherwise, you might be catching a falling knife. First of all, the price support area of 23300 in Dow must hold. The index should find support there and stabilize. The keyword here is "stabilize". You want to see a slowing down in selling momentum before you consider buying stocks.
In the event that the 23300 area does not hold, then there will be more selling in the Dow. That will bring the Dow down to the 22000 area which is the next price support level.
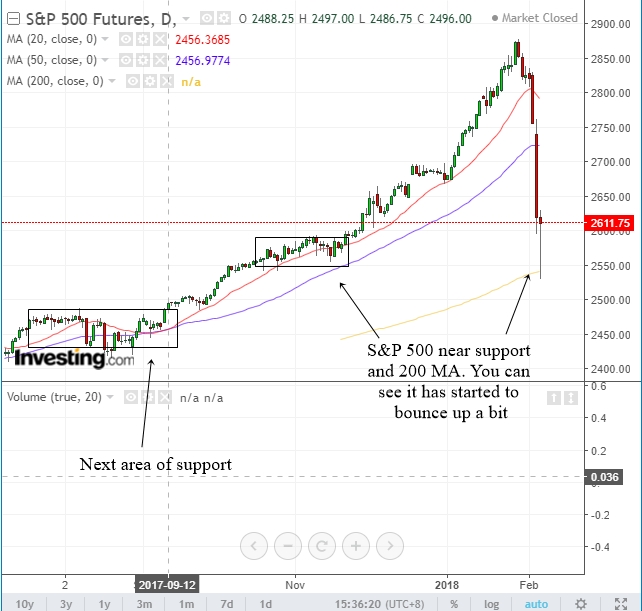
The chart above is the daily chart of the S&P 500 Futures. As you can see, things happen very fast in the stock market. The S&P 500 has started to bounce up a bit as it reaches price support and the 200 MA. If it can close the day higher, it will form what traders call a bottoming tail. A bottoming tail pattern can often point to a reversal. The next area of support for the S&P 500 will be the 2450 area.
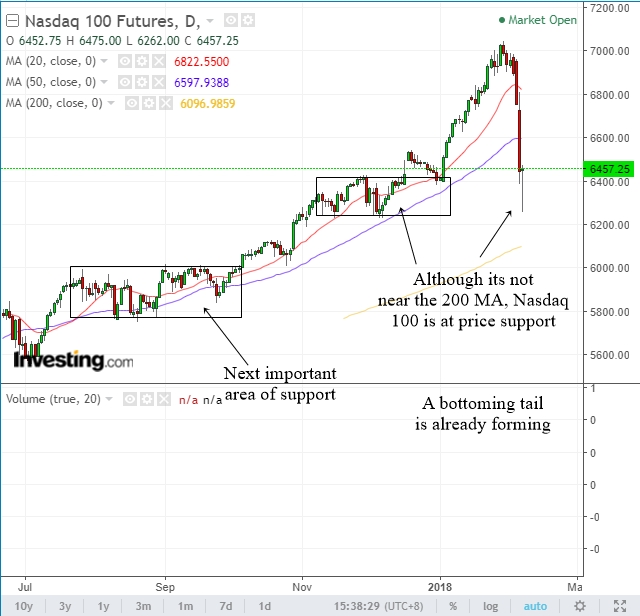
The chart above is the daily chart of the Nasdaq 100 Futures. As you can see, the Nasdaq 100 is also trying to form a bottoming tail as it hits the support area. Although it is not near the psychological 200 MA, there is enough support to keep it from dropping further at the moment. The next important area of support will be the 6000 area.
What we have done just now is to look at the big picture of the stock market by studying the support areas for the Dow Jones, the S&P 500 and the Nasdaq 100. Since 75% of stocks follow the direction of these main indices, we can expect some slowing down in selling momentum for most stocks. We are now at an important support area for all 3 major indices. If selling slows down and price stabilizes at these support areas, then this might be a great place to start buying stocks again.


