Covered call writing exit strategies include scenarios when share price moves up or down. Our main enemy is share depreciation where we need to mitigate losses but we must also have the ability to enhance returns when share price rises under certain specific conditions. This article will evaluate a trade sent to us by Mario G on a stock (THO) that moved from $100.00 to $108.64 per share mid-contract. With two weeks remaining until contract expiration, we must evaluate the opportunity to use the mid-contract unwind exit strategy to generate a second income stream in the same month with the same cash.
Mario’s trade (Mario used multiple contracts but I will use 1 contract to simplify the math)
- 1/21/2017: Buy Thor Industries Inc (NYSE:THO) at $100.00
- 1/21/2017: Sell 2/18/2017 $100.00 call for $3.00 (I assumed a 3% return, not implicit in Mario’s email nor critical to this article)
- 2/6/2017: THO trading at $108.64
- 2/6/2017: Bid-ask spread on short call is $6.30 – $9.00
Mario astutely noted that THO had a projected earnings report date of 3/6/2017 and therefore would not be including this security in his portfolio for the March contracts.
Practical criteria used to determine whether to close our deep in-the-money strikes
Since an at-the-money strikes was initially sold, there is no opportunity to generate additional profit from share appreciation. Mario has maximized his 3%, 1-month return and THO can drop in price by 8% and that 3% will still be realized…a nice position to be in. However, as Blue Collar Investors, we dig deeper. What will be our actual time value cost-to-close and can we generate a greater return than that cost-to-close in a completely new position in the two weeks remaining in the contract? For premium members who have access to the Elite version of the Ellman Calculator (also available in the Blue Collar store for non-members), the “Unwind Now” tab can be used for this calculation. If the cost-to-close is such that we can generate a return of at least 1% greater than to actual cost to close, it is worth closing. Some investors may set a higher or lower parameter but that is mine. For example, if the cost to close is 0.5% and we can generate a 1.5% initial profit in a new position, it is worth considering.
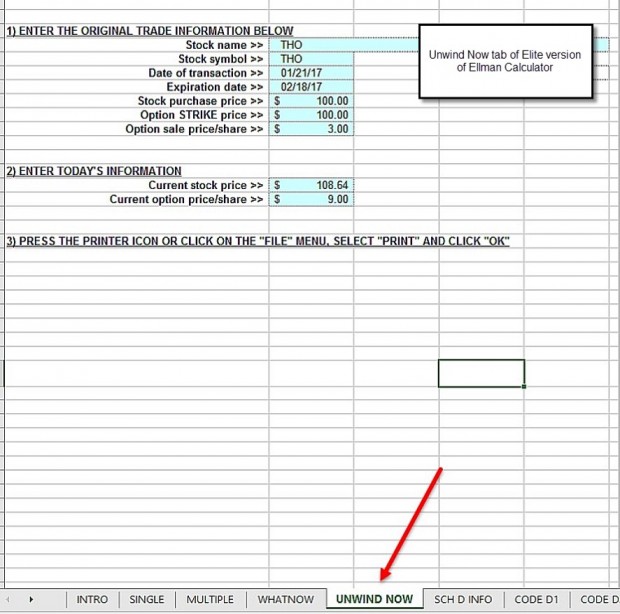
“Unwind Now” tab of the Elite Ellman Calculator: Input

In this case, the strike is $8.64 in-the-money. This means, the cost-to-close will be $8.64 + a time value component. If the bid-ask spread is $6.30 – $9.00, the cost-to-close will be between $8.64 and $9.00. Let’s use worst case scenario and say $9.00.
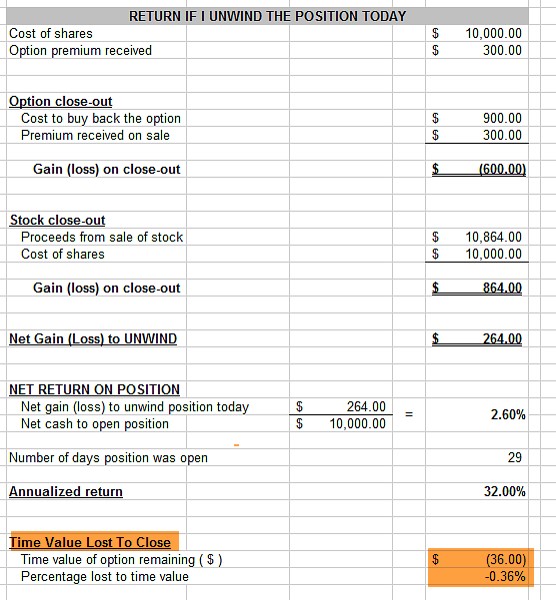
“Unwind Now” tab of the Elite Ellman Calculator: Calculation results

This demonstrates that the time value cost-to-close is $0.36 0r 0.36% My threshold would be 1.36% or higher for initial time value return on a new position or I would allow assignment and congratulate myself on an outstanding trade.
Discussion
Thanks to Mario for inspiring this article.
For more information on the mid-contract unwind exit strategy:
Complete Encyclopedia for Covered Call Writing- Classic version: 264 – 271
Complete Encyclopedia for Covered call Writing- Volume 2: 243 – 252
(Hard cover versions also available only on this website).
Market tone
Global stocks moved slightly higher this week along with continued strength in US markets as another impressive earnings season passes. The Dow surpassed the 22,000 level during the week, supported by positive economic data. West Texas Intermediate crude oil prices ended the week near $49, down slightly from last week’s $49.65. Volatility, as measured by the Chicago Board Options Exchange Volatility Index (VIX), declined to 10.03 from 11.0 a week ago. This week’s economic and international news of importance:
- The unemployment rate moved down to 4.3%, matching a recent 16-year low
- The economy added another 209,000 jobs, handily exceeding the 180,000 6-month average
- Despite solid job growth, wages remain restrained, with average hourly earnings holding steady at a 2.5% annual growth rate. The upbeat data should keep the US Federal Reserve on course for another rate hike before year’s end
- Special counsel Robert Mueller has empaneled a grand jury in Washington, D.C., to investigate Russian interference in the 2016 US presidential election
- The Dow Jones Industrial Average broke and closed above the 22,000 level for the first time. Solid corporate earnings and a weakening US dollar are providing a favorable backdrop for stocks
- Donald Trump, fearing that a veto would be overridden by Congress, this week signed a sanctions bill that targets Russia’s energy and defense sectors
- The Trump administration is considering taking trade action against China and is discussing launching a probe into Beijing’s insistence that foreign companies transfer technology to local Chinese subsidiaries and partners
- Former Fed chairman Alan Greenspan said that we are experiencing a bubble, not in stock prices, but in bond prices
- The Czech central bank took action on Thursday, raising its main policy rate from 0.05% to 0.25%, its first hike since 2008
- According to Thomson Reuters, with 75% of the companies in the S&P 500 Index having reported, Q2 earnings are expected to increase 11.8% compared with a year ago
- Revenues are expected to increase by 5% compared with Q2 2016
For the week, the S&P 500 moved up by 0.19% for a year-to-date return of 10.63%
Summary
IBD: Market in confirmed uptrend
GMI: 5/6- Buy signal since market close of July 13, 2017
BCI: I am currently favoring out-of-the-money strikes 3-to-2.
WHAT THE BROAD MARKET INDICATORS (S&P 500 AND VIX) ARE TELLING US
The 6-month charts point to a mildly bullish outlook. In the past six months, the S&P 500 was up 8% while the VIX (10.03) moved down by 12%.
Much success to all,
