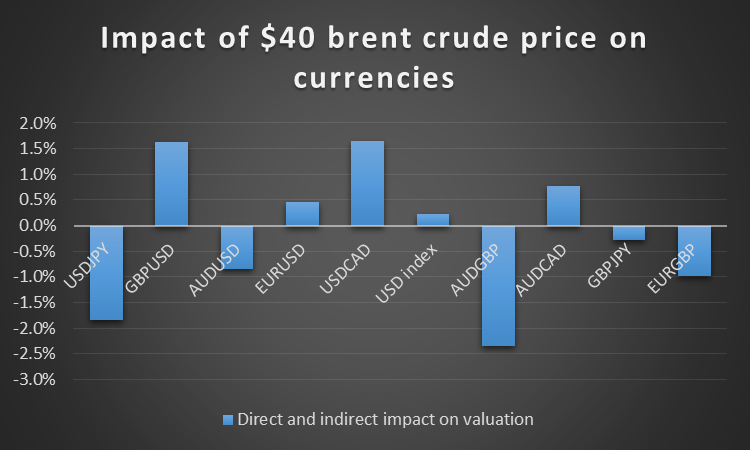
Whilst commodity prices are very difficult to predict, current sentiment is that the crude oil price will go lower. Utterances from the Saudi oil minister suggest a target of as low as $20, the futures price recently fell below the psychological $50 and our own fair value indicator has the value on fundamentals at $45-$50. Markets can turn on a dime, but we thought we would investigate – what would $40 oil mean for the major currency pairs?
Our fair value model allows us to test just that – we can overlay any price we wish on the current price and the model will recalculate fair values based on the set of 22-driver-variable multiple regression equations. (The model will allow for indirect effects of the price change on the driver variables as well as the direct effect on the independent variable).
The results are graphed below.

It can be seen that USD/JPY and AUD/GBP are the most vulnerable, with GBP/USD and USD/CAD being the main beneficiaries.
Overall, the results do not seem overly sensitive given that we are discussing a 30% drop in the oil price from current levels. Looked at another way - the standard deviation of weekly exchange rate changes for majors is around 2%, so the worst case change (-2.3% for AUD/GBP) is a little over the average weekly fluctuation.
What supports the discussion?
At www.fairvalueonline .com we make fair value estimates for 27 series using multiple regression analyses of 6.5 years of daily price data. The series are:
Tradeable securities
Stock indices:
DAX, CAC40, FTSE, SP500, Shanghai Composite, Hang Seng, Nikkei, ASX200
USD currencies:
USD/JPY, GBP/USD, AUD/USD, EUR/USD, USD/CAD
Cross currencies:
AUD/GBP, AUD/CAD, GBP/JPY, EUR/GBP
Commodities:
Other driver variables used in the regressions:
VIX, SP500 earnings per share, ASX 200 earnings per share, US dollar index, US 30-Year bond rate, Australian 10-Year bond rate, Baltic Dry Index.
For all the series excluding the cross currencies, 23 regressions are run with the other 22 series being independent (driver) variables. The goodness of fit is very high with “R-squared” typically above 95%. The regressions are rerun weekly with a rolling data set kept at 6.5 years (the earliest week is dropped off as the latest is added).
For the cross currencies, the series applying to each currency is regressed against 22 of the other series (excluding the other cross currencies).
Each day, the previous day’s closing prices are input into the equations to give an updated fair value estimate for each of the 27 variables. A percentage under/over valuation is calculated by relating the latest prices to the updated fair value estimates (to show as undervaluation if latest price is less than fair value and over valuation if conversely).
Also shown is the price/fair value ratio applying now minus that applying five trading days previously. This gives an indication of whether the security has become relatively more expensive (increase in price/value ratio) or relatively cheaper (decrease in price/value ratio) over the last five trading days.
