We have a light week for data, but plenty of other big news. Earnings season continues. There will be plenty of FedSpeak, and most importantly the results of the U.S. elections. I expect everyone to be asking:
Will the election results provide clarity for financial markets?
Personal Note
I know that some readers will not like my conclusions this week. Please read them as investment advice, not voting advice.
Thanks also to readers for the interest and early comments for my latest paper, The Top Twelve Investor Pitfalls – and How to Avoid Them. Readers of WTWA can get a copy by sending an email to info at newarc dot com. We will not share your address with anyone.
Last Week
Last week’s economic news was all good, despite the modest negative reaction in stocks. The election story is the culprit.
Theme Recap
In my last WTWA (two weeks ago), I predicted a focus on the trading range, and whether it would soon be broken. Breaking election news attracted most of the attention with earnings playing a secondary role. Since then, we have experienced a 40-year flood, so to speak. The nine consecutive days of market declines are the most for 36 years. And still counting. Whether the range has been broken remains open to question, but I was wrong about the key theme.
The Story in One Chart
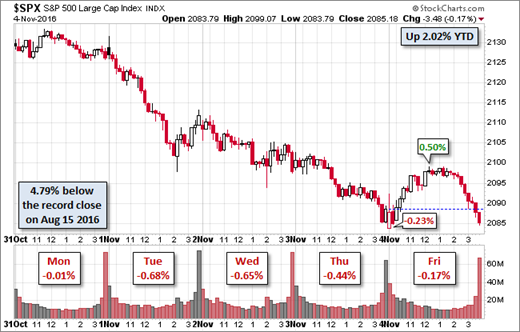
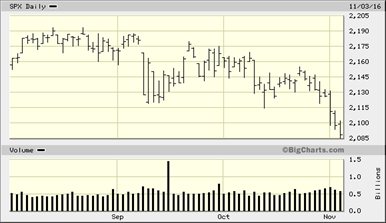
I always start my personal review of the week by looking at this great chart of the S&P 500 from Doug Short. Some sources said the market was in the “grip of the worst decline since the financial crisis.” Doug notes that the nine days of decline amounted only to 3.09%. By comparison, the nine-day streak from 36 years ago represented 9.37%. Even single-day declines can be more than this, including the -3.59% on June 24th of this year. Doug’s analysis helps to put the recent trading in perspective.
Doug has a special knack for pulling together all the relevant information. His charts save more than a thousand words! Read his entire post where he adds analysis grounded in data and several more charts providing long-term perspective.
The News
Each week I break down events into good and bad. Often there is an “ugly” and on rare occasion something very positive. My working definition of “good” has two components. The news must be market friendly and better than expectations. I avoid using my personal preferences in evaluating news – and you should, too!
The Good
- Personal income and spending were up 0.3% and 0.5% respectively. These results were better than the prior month, and in line with expectations.
- ISM manufacturing index registered 51.9 beating the prior month and most expectations. This is roughly consistent with recent GDP readings.
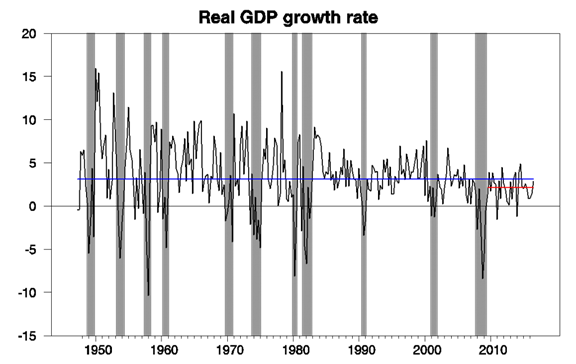
- GDP for Q3 increased 2.9%, the highest rate in two years. James Hamilton notes that this is still slightly below the long-term trend, but good enough to reduce the recession odds of his model to 12.3%.
Some skeptics have claimed that the good report is “full of beans” in the words of Dr. Ed Yardeni. While the one-time effect of soybean imports was important, he cites several other factors that suggest future strength.
- Earnings strength continues. Despite the importance of this story, it has not gotten much attention. The earnings recession is over, as I concluded from our first-rate sources a few weeks ago. FactSet has some key points in their update:
- 71% of S&P 500 companies have reported earnings above the mean estimate and 54% of S&P 500 companies have reported sales above the mean estimate.
- For Q3 2016, the blended earnings growth rate for the S&P 500 is 2.7%. If the index reports growth in earnings for the quarter, it will mark the first time the index has seen year-over-year growth in earnings since Q1 2015 (0.5%).
- Corporate narrative agrees. Avondale Asset Management tracks hundreds of earnings calls. Their helpful summary includes quotations from the calls, organized into topics. Here is the encouraging list of topic headings for the U.S. macro section. There is supporting evidence for each of the points below.
The environment has stayed slow and steady
The economy is fully healed even if it’s not setting new records
Conditions are still pretty difficult for industrial companies, but turning up
Still, there’s a pervasive sense of uncertainty
CEOs are waiting to see what happens in the election
Companies are setting strategic plans that assume weakness
The consumer has been slowing
But energy and currency are moving from a headwind to a tailwind
Inventories are much leaner than they have been
And pricing pressures are building
- Employment
- Non-farm payrolls increased by 161,000 and the prior month was revised upward by 35,000.
- ADP private employment growth was 147K, 23,000 less than expected, but the prior month was revised up by 48,000.
- Unemployment decreased slightly to 4.9%.
- Hourly earnings increased 2.8% on a year-over-year basis –
- One slight negative was initial jobless claims edging higher by 7000, but still historically low at 265K.
The Bad
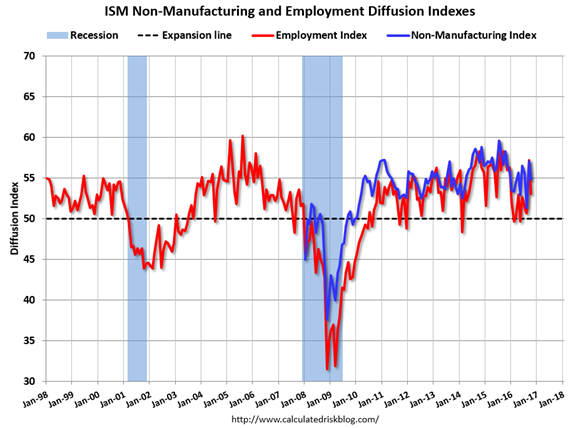
- ISM non manufacturing registered at 54.8, down from 57.1 in September and missing expectations. Calculated Risk has the story, highlighting a comment in the report about the effect of uncertainty from the Presidential election.
The Ugly
The last days of a very personal and negative election campaign. Scott Grannis called for a “mulligan.” (For non-golfers, a complete do-over). I would probably just slice another drive into the rough! If you want to change outcomes, you must be willing to reform the process and go to work on your swing. In such a long election season, campaign managers finally resort to techniques that are proven to influence the undecided and the faithful. You and I might be turned off, but we are not the target market.
The Silver Bullet
I occasionally give the Silver Bullet award to someone who takes up an unpopular or thankless cause, doing the real work to demonstrate the facts. This week’s winner is Bill McBride of Calculated Risk. Debunking recession calls is not popular. It is not the way to get page views. Please read Bill’s entire post to see the full story about the endless parade of recession calls. Here are some of the key points:
Note: I’ve made one recession call since starting this blog. One of my predictions for 2007 was a recession would start as a result of the housing bust (made it by one month – the recession started in December 2007). That prediction was out of the consensus for 2007 and, at the time, ECRI was saying a “recession is no longer a serious concern”. Ouch.
For the last 6+ years [now 7+ years], there have been an endless parade of incorrect recession calls. The most reported was probably the multiple recession calls from ECRI in 2011 and 2012.
In May of [2015], ECRI finally acknowledged their incorrect call, and here is their admission : The Greater Moderation
In line with the old adage, “never say never,” [ECRI’s] September 2011 U.S. recession forecast did turn out to be a false alarm.
I disagreed with that call in 2011; I wasn’t even on recession watch!
And here is another call [last December] via CNBC: US economy recession odds ’65 percent’: Investor
Raoul Pal, the publisher of The Global Macro Investor, reiterated his bearishness … “The economic situation is deteriorating fast.” … [The ISM report] “is showing that the U.S. economy is almost at stall speed now,” Pal said. “It gives us a 65 percent chance of a recession in the U.S..
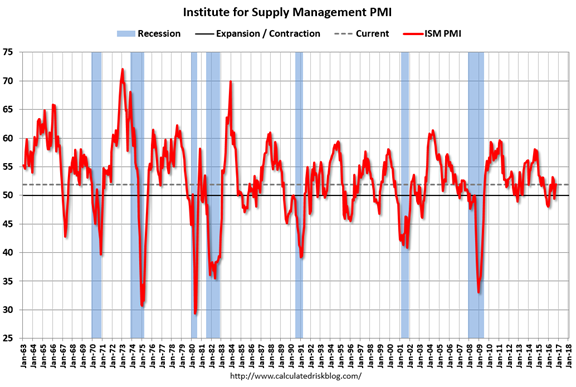
The manufacturing sector has been weak, and contracted in the US in November due to a combination of weakness in the oil sector, the strong dollar and some global weakness. But this doesn’t mean the US will enter a recession.
The last time the index contracted was in 2012 (no recession), and has shown contraction a number of times outside of a recession.
Bill cites this chart:
Bob Dieli also made both of those calls in real time, as he has been doing for a few decades. His work goes mostly to private clients. It helps all of us to monitor objective sources like this. They benefit only from being right.
The Week Ahead
We would all like to know the direction of the market in advance. Good luck with that! Second best is planning what to look for and how to react. That is the purpose of considering possible themes for the week ahead. You can make your own predictions in the comments.
The Calendar
We have a light week for economic data, but some important earnings reports for retail stocks. I watch everything on the calendar, so you do not need to! Check out WTWA to focus on what is important – and ignore the noise.
The “A” List
- JOLTs report (M). Few understand, but the main use is labor market structure.
- Michigan Sentiment (F). Has been weaker than the Conference Board version. An important indicator.
- Initial claims (Th). The best concurrent indicator for employment trends.
The “B” List
- Wholesale inventories (W). Volatile and challenging to interpret. Rebound expected.
- Crude inventories (W). Recently showing even more impact on oil prices. Rightly or wrongly, that spills over to stocks.
More important than the economic data will be continuing earnings news. We also have almost daily Fedspeak and plenty of international events and speeches. And most important of all – the election.
Next Week’s Theme
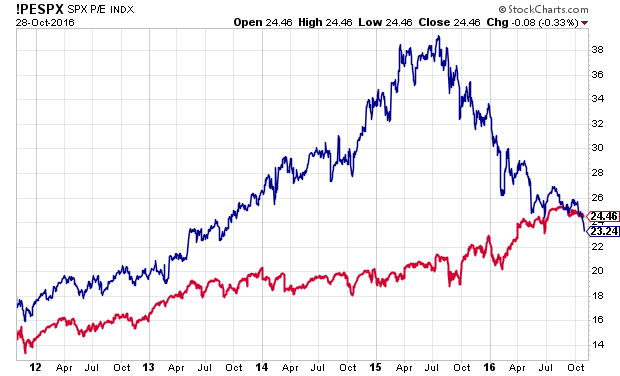
With increasing uncertainty about the election outcome and resulting policies, markets pushed the trading range lower over the last two weeks. Eddy Elfenbein describes this as an extended period of small lower moves. Each of the daily declines has been less than 0.7%. During the same period, the economy has been showing signs of acceleration. Eddy provides a helpful chart:
Earnings have also been solid in the face of the longest market losing streak in 36 years. I expect discussion of the election and the implications of the results to be the key market question:
Will we finally get some clarity?
The possible election results are not binary. There is a wide range of possible outcomes, listed below from bearish to bullish. Please note that I am not opining about who I want to win or how you should vote. I am reporting how the market will probably react under differing circumstances, with some references for you to start your own research.
- No clear result. We might think it’s over when it’s over, but that might not be the case. (Robert Schroeder, MarketWatch)
- Some states might require recounts, either automatic by state law or after a challenge.
- A third-party candidate might win the electoral votes of one state in a close split between the major parties. That is the explicit objective of candidate Evan McMullin.
- Trump and /or supporters might challenge the outcome, possibly with some legal basis. Most people will remember the Bush/Gore controversy and the infamous “hanging chads.”
- The Supreme Court decided that dispute, splitting along partisan lines. Right now, that would be a 4-4 vote, placing emphasis on how states and lower courts decided.
- A Trump victory. Estimates are that the market would decline by 5-7%, mostly because of increased uncertainty. Many market participants believe that Trump economic and regulatory policies would be market-friendly. (CNBC)
- A Democratic sweep with a majority in both houses of Congress. The perception, possibly not accurate, is that this would allow a much more aggressive legislative agenda. This is probably not accurate because of the filibuster potential in the Senate. Cloture currently requires 60 (out of 100) votes. This serves to block nearly everything that does not have solid overall support. Making it more complicated is the idea of the “nuclear option” where the cloture requirement would be reduced. (Barbara Kollmeyer, MarketWatch)
- Divided control — a Clinton Presidential victory with Republicans maintaining control of one or both houses of Congress. Markets have generally liked a deadlocked government. (Allianz)
Which of these will happen? Join in the comments with your thoughts about the election implications. As always, I’ll have a few ideas of my own in the conclusion.
Quant Corner
We follow some regular great sources and the best insights from each week.
Risk Analysis
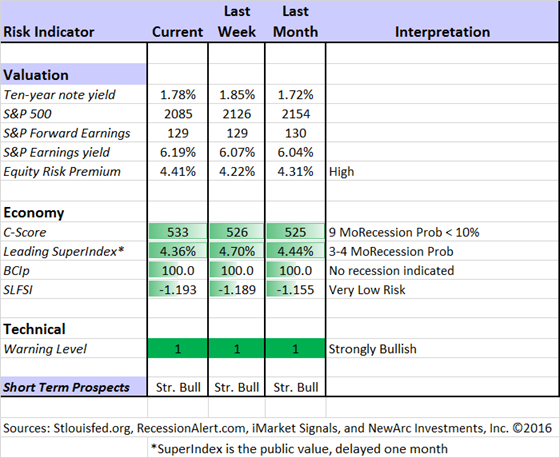
Whether you are a trader or an investor, you need to understand risk. Think first about your risk. Only then should you consider possible rewards. I monitor many quantitative reports and highlight the best methods in this weekly update.
The Indicator Snapshot
The Featured Sources:
Bob Dieli: The “C Score” which is a weekly estimate of his Enhanced Aggregate Spread (the most accurate real-time recession forecasting method over the last few decades). His subscribers get Monthly reports including both an economic overview of the economy and employment.
Holmes: Our cautious and clever watchdog, who sniffs out opportunity like a great detective, but emphasizes guarding assets.
Brian Gilmartin: Analysis of expected earnings for the overall market as well as coverage of many individual companies.
Doug Short: The Big Four Update, the World Markets Weekend Update (and much more).
Georg Vrba: The Business Cycle Indicator, and much more. Check out his site for an array of interesting methods. Georg regularly analyzes Bob Dieli’s enhanced aggregate spread, considering when it might first give a recession signal. Georg thinks it is still a year away. It is interesting to watch this approach along with our weekly monitoring of the C-Score.
RecessionAlert: Many strong quantitative indicators for both economic and market analysis. While we feature his recession analysis, Dwaine also has several interesting approaches to asset allocation. Try out his new public Twitter Feed.
How to Use WTWA (important for new readers)
In this series, I share my preparation for the coming week. I write each post as if I were speaking directly to one of my clients. Most readers can just “listen in.” If you are unhappy with your current investment approach, we will be happy to talk with you. I start with a specific assessment of your personal situation. There is no rush. Each client is different, so I have six different programs ranging from very conservative bond ladders to very aggressive trading programs. A key question:
Are you preserving wealth, or like most of us, do you need to create more wealth?
My objective is to help all readers, so I provide several free resources. Just write to info at newarc dot com. We will send whatever you request.
- Understanding Risk – what we all should know.
- Income investing – better yield than the standard dividend portfolio, and less risk.
- Holmes and friends – the top artificial intelligence techniques in action.
- Why it is a great time to own for Value Stocks – finding cheap stocks based on long-term earnings.
You can also check out my website for Tips for Individual Investors, and a discussion of the biggest market fears. (I welcome questions on this subject. What scares you?)
Best Advice for the Week Ahead
The right move often depends on your time horizon. Are you a trader or an investor?
Insight for Traders
We consider both our models and the top sources we follow.
Felix and Holmes
We continue with a strongly bullish market forecast. Felix is fully invested. Oscar holds several aggressive sectors. The more cautious Holmes also remains fully invested. They now have a regular Thursday night discussion, which they call the “Stock Exchange.” This week the gang came up with some contrarian, pre-election ideas. You can see the best technical analysis – and you can ask questions!
Top Trading Advice
Brett Steenbarger cites that noted trading guru, Bruce Lee, to illustrate our need to be flexible in trading.
In another post he emphasizes the need to ask the right questions. As he often does, this is a good technique for other life missions, not just trading. He uses an excellent specific example of VIX trading.
Options expert Bill Luby sheds some light on VIX trading, a widely misunderstood topic. He explains the difference between “median reversion” and using five-year moving averages. I doubt that most have event considered this significance.
Insight for Investors
Investors have a longer time horizon. The best moves frequently involve taking advantage of trading volatility!
Best of the Week
If I had to pick a single most important source for investors to read this week it would be Ben Carlson’s post, Don’t Be Afraid of All-Time Highs in the Stock Market. This is a concern that you see often, because many people equate a high level of the index with “expensive.” It is also true that declines begin from a peak. Forgotten in this is that most peaks lead to new peaks! Here is a key table:
And a key quotation:
Here’s also another way to think about this — since nearly 7% of all days since 1950 have been an all-time high that means that more than 93% of the time the stock market is in a drawdown state from a previous peak. So 9 times out of 10 you are going to be beating yourself up for not selling at the previous high. This is what makes the markets so interesting and excruciating all at the same time. Most of the time you’re in a state of regret.
Stock Ideas
Many people are mystified by the PEG ratio. Chuck Carnevale does a deep dive on the derivation and provides examples to show when and how it should be applied. If you invest in growth stocks, this is a must-read article with many ideas.
Brian Gilmartin draws upon the changes in earnings estimates to highlight attractive sectors for Q416. This is extremely helpful work, and worth a close read. Hint: Technology and Financials.
Is health care a sector to avoid or to embrace? Eddy Elfenbein comments on the decline in the group since July, 2015.
Our trading model, Holmes, has joined our other models in a weekly market discussion. Each one has a different “personality” and I get to be the human doing fundamental analysis. We have an enjoyable discussion every week, with four or five specific ideas that we are also buying. This week Holmes likes Biomarin (NASDAQ:BMRN). Check out the post, link above, for my own reaction, and more information about the Holmes method.
While we cannot verify the suitability of specific stocks for everyone who is a reader, the ideas have worked well so far. My hope is that it will be a good starting point for your own research. Holmes may exit a position at any time. If you want more information about the exits, just sign up via holmes at newarc dot com. You will get an email update whenever we sell an announced position.
How about housing? Barry Ritholtz has a great post highlighting the big best on housing by one of those who called the decline and has now switched sides, fund manager Donald Mullen. The entire post is worth reading, but here is the key argument:
Given how wary some people are of homeownership, why should we be thinking about demand strengthening? Here are a few possibilities:
- Millennials seem to be moving out of their parents’ basements, and forming households;
- Mortgage rates are starting to rise, and the potential for further rate increases could lead potential buyers to getting off the fence;
- Low equity constrains inventory; that drives up rental demand as well as prices;
- The economy continues to recover and even expand;
- Unemployment has been about 5 percent for about a year, and wage increases are finally beginning.
All of these add up to an increase in the number of households, including renters — many of whom go on to become buyers.
This is also what we see from the Calculated Risk reporting on home prices, consistently higher but with room to run.
Personal Finance
Professional investors and traders have been making Abnormal Returns a daily stop for over ten years. If you are a serious investor managing your own account, you should join us in adding this to your daily reading. Every investor should make time for a weekly trip on Wednesday. Tadas always has first-rate links for investors in his weekly special edition. There are always several great choices worth reading. My personal favorite this week is the story about how even math teachers cannot understand 403-b annuities. Tara Siegel Bernard explains in the NYT. I have a lot of experience with people who come to me, seeking to escape something that sounded great at the time. The products are fine for some people, but because of high commissions are sold to many more. Anyone considering an annuity needs some advice ahead of time.
Another good piece is the Barron’s Next article on excessive concentration in stock of your own company. I have seen millionaires lose everything that way.
Seeking Alpha Editor Gil Weinreich’s market is the community of financial advisors, but it also attracts spirited comments from investors. I especially enjoyed this post featuring retired RIA Jim Sloan. The topic is one I rarely cover in WTWA – spending. I focus on clients’ investment plans; these must match their spending needs. Sometimes it is better to find a few economies than to take excessive risk.
Morgan Housel pulls together some themes that are among my favorites. It is a good explanation of why even the smartest individual investors go wrong. Hint: You are good enough to explain why it is not working and toward complex solutions.
Watch out for…
Facebook? Marc Gerstein provides an interesting and balanced analysis, driven by his quantitative methods.
Final Thoughts
The election outcomes that the market sees as most distressing are extremely unlikely. The best sources I follow suggest a Clinton victory, a toss-up in the Senate, and the GOP retaining the House. These are not partisan pollsters, but those who benefit only from accurate interpretation of data. Here are the key sources and a starting link. The message changes with new information, as we would expect. Barring any fresh news, the outcome has a high probability.
Larry J. Sabato of the University of Virginia Center for Politics.
Nate Silver, a numbers guru with respect from the Political Science community.
Sam Wang and the Princeton Election Consortium. Their method of median-based probability estimation is interesting and plausible.
The resulting gridlock will be perceived as positive. That will be true only if our leaders learn to compromise. There are decisions ahead that require action.
The first market reaction will be positive, if only because the worst cases were avoided and the uncertainty ended. Hedge fund managers who have lagged the market and are hoping to catch up via big short positions will need to cover. Based upon trader commentary and performance reports, this is a large group.
The second reaction will be sector and stock specific, and it will take time. Most of the financial punditry does not realize the limitations on Presidential power. I expect changes in drug pricing policies, for example, but not a sweep against an entire sector. The targets will be the most egregious excesses.
I understand that many people will disagree with these conclusions, despite my care in identifying sources. They will have theories about bad polls, hidden voters, and the like. I recommend reading this post. It is fine to keep cheering for your candidates until the last vote is tallied, but you do not have to lose money as well.
Which stock should you buy in your very next trade?
AI computing powers are changing the stock market. Investing.com's ProPicks AI includes 6 winning stock portfolios chosen by our advanced AI. In 2024 alone, ProPicks AI identified 2 stocks that surged over 150%, 4 additional stocks that leaped over 30%, and 3 more that climbed over 25%. Which stock will be the next to soar?
Unlock ProPicks AI
