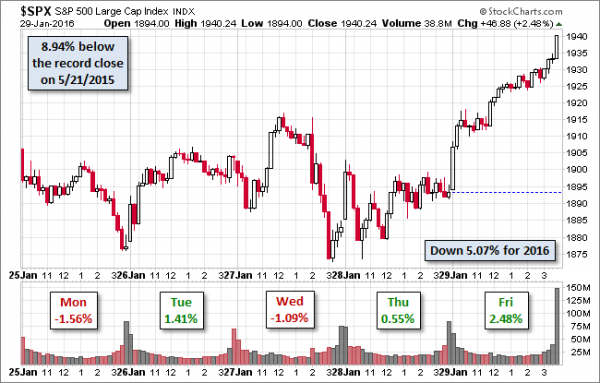
Stocks once again made a sharp turnaround late in Wednesday’s session. The “mystery” rebound took the S&P 500 up 3.5% in about two days of trading. Despite the important economic releases and heavy earnings calendar next week, expect the punditry to be asking:
Is the correction over?
Prior Theme Recap
In my last WTWA I predicted that everyone would be watching for a dovish tilt from the Fed. That was certainly the big story for the first part of the week, including several programs that used the “dovish tilt” phrase. Even after the Fed meeting, speculation about the “real meaning” of the FOMC statement remained newsworthy. The initial reaction was that the message was indeed a dovish tilt. The brief rally quickly turned negative. By day’s end the agreed theme was that the Fed had not gone far enough. Or maybe was signaling weakness. Or maybe they were confused. You can see the turnaround in stocks from Doug Short’s weekly chart. (With the ever-increasing effects from foreign markets, you should also add Doug’s World Markets Weekend Update to your reading list).

Doug’s update also provides multi-year context. See his full post for more excellent charts and analysis.
We would all like to know the direction of the market in advance. Good luck with that! Second best is planning what to look for and how to react. That is the purpose of considering possible themes for the week ahead. You can make your own predictions in the comments.
This Week’s Theme
There is a big economic calendar this week, featuring the employment report on Friday. There is also a continuing flow of major earnings reports. Despite this I expect the debate over last week’s market action to remain at center stage. Everyone will be wondering –
Is the correction over?
Since the decline from the market peak is now below 10%, the market is out of correction territory. Since there is so much disagreement about what brought the rebound, no one really knows if the improvement in stocks will stick.
Listed below are popular arguments from Thursday and Friday. I expect support for each as we try to interpret the big week of news.
- The surprise cut in rates from the Bank of Japan.
- Fed “clarification” of the statement in subsequent appearances.
- Stronger oil prices.
- End-of-month buying.
- Short covering.
- Some improvement in earnings reports.
- Some improvement in the late-week economic data.
As always, I have my own opinion in the conclusion. But first, let us do our regular update of the last week’s news and data. Readers, especially those new to this series, will benefit from reading the background information.
Last Week’s Data
Each week I break down events into good and bad. Often there is “ugly” and on rare occasion something really good. My working definition of “good” has two components:
- The news is market-friendly. Our personal policy preferences are not relevant for this test. And especially – no politics.
- It is better than expectations.
The Good
On balance the news was pretty good last week.
- Initial jobless claims decreased to 278K. The less volatile four-week moving average dropped slightly. The recent drift higher had attracted some attention as a possible warning about weaker net job growth. The overall level remains encouraging, but last week’s report is not part of the time period for Friday’s employment report.
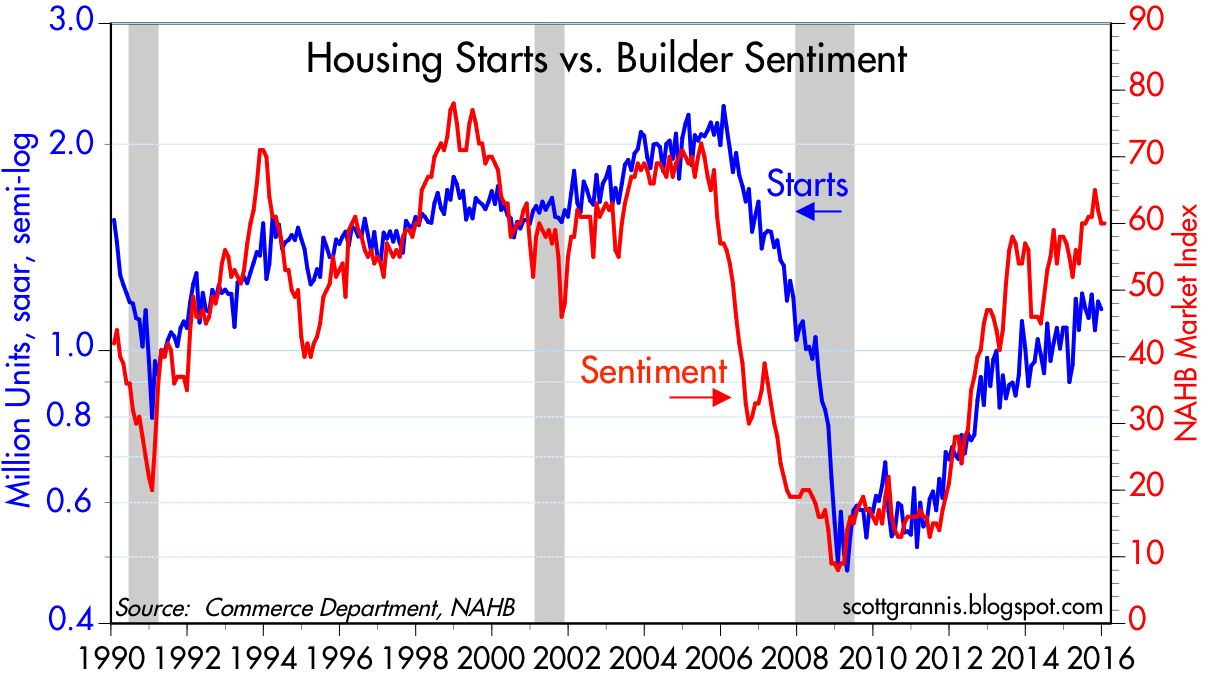
- New home sales hit the highest level in almost a year. The annualized rate was 544K, significantly higher than expectations. Scott Grannis sees room to run. See the other dozen charts in this post.

- Consumer confidence was strong in the Conference Board version – 98.1
- Chicago PMI surprised at 55.6. This is a sharp rebound from the low levels of the past few months, including the prior read of 42.9
The Bad
Some of the economic data was disappointing.
- Q4 GDP grew only 0.7% slightly lower than reduced expectations. While “old news” it is still a discouraging base for future growth. New Deal Democrat finds a few positives in the report.
- Pending home sales disappointed with a gain of only 0.1% and a downward revision for the prior month. (Calculated Risk)
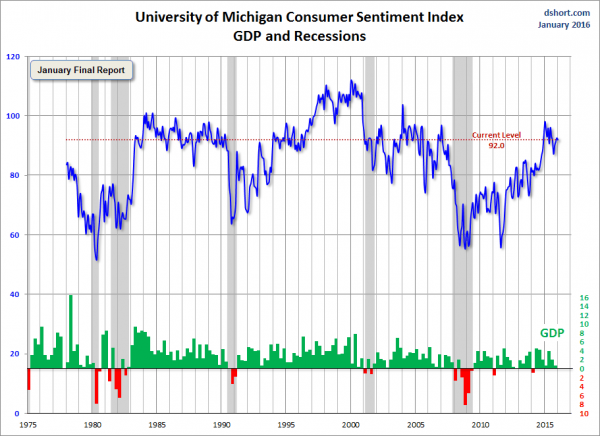
- Consumer sentiment was disappointing according to the University of Michigan survey. Doug Short is the authoritative source on sentiment and economic links, with a package of excellent charts.

- Durable goods orders fell 4.3% with the year-over-year decline in the core rate even worse.
The Ugly
The “doomsday clock” remains at three minutes before midnight.
The Silver Bullet
I occasionally give the Silver Bullet award to someone who takes up an unpopular or thankless cause, doing the real work to demonstrate the facts. Think of The Lone Ranger. No award this week.
Quant Corner
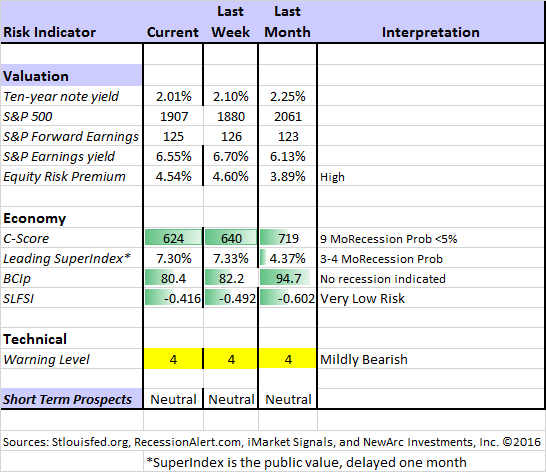
Whether a trader or an investor, you need to understand risk. I monitor many quantitative reports and highlight the best methods in this weekly update. Beginning last week I made some changes in our regular table, separating three different ways of considering risk. For valuation I report the equity risk premium. This is the difference between what we expect stocks to earn in the next twelve months and the return from the ten-year Treasury note. I have found this approach to be an effective method for measuring market perception of stock risk. This is now easier to monitor because of the excellent work of Brian Gilmartin, whose analysis of the Thomson-Reuters data is our principal source for forward earnings.
Our economic risk indicators have not changed.
In our monitoring of market technical risk, I am now using our new model, “Holmes”. Holmes is a friendly watchdog in the same tradition as Oscar and Felix, but with a stronger emphasis on asset protection. We have found that the overall market indication is very helpful for those investing or trading individual stocks. The score ranges from 1 to 5, with 5 representing a high warning level. The 2-4 range is acceptable for stock trading, with various levels of caution.
The new approach improves trading results by taking some profits during good times and getting out of the market when technical risk is high. This is not market timing as we normally think of it. It is not an effort to pick tops and bottoms and it does not go short.
Interested readers can get the program description as part of our new package of free reports, including information on risk control and value investing. (Email requests to main at newarc dot com).
In my continuing effort to provide an effective investor summary of the most important economic data I have added Georg Vrba’s Business Cycle Index, which we have frequently cited in this space. In contrast to the ECRI “black box” approach, Georg provides a full description of the model and the components.
For more information on each source, check here.
Recent Expert Commentary on Recession Odds and Market Trends
Bob Dieli does a monthly update (subscription required) after the employment report and also a monthly overview analysis. He follows many concurrent indicators to supplement our featured “C Score.”
Georg Vrba: provides an array of interesting systems. Check out his site for the full story. We especially like his unemployment rate recession indicator, confirming that there is no recession signal. He gets a similar result with the twenty-week forward look from the Business Cycle Indicator, updated weekly and now part of our featured indicators.
Doug Short: Provides an array of important economic updates including the best charts around. One of these is monitoring the ECRI’s business cycle analysis, as his associate Jill Mislinski does in this week’s update. His Big Four update is the single best visual update of the indicators used in official recession dating. You can see each element and the aggregate, along with a table of the data. The full article is loaded with charts and analysis.
RecessionAlert: A variety of strong quantitative indicators for both economic and market analysis. While we feature the recession analysis, Dwaine also has a number of interesting systems. These include approaches helpful in both economic and market timing. He has been very accurate in helping people to stay on the right side of the market.
Mark Thoma has an excellent analysis – clearly written and not requiring an economics degree to understand – of the problems in measuring well-being through the GDP. A few minutes with this article will illustrate the why the measure can be either exaggerated or understated.
The Davos discussion, however, is pointed at a different flaw in measured GDP: its inability to fully capture the benefits of technology. Think of a free app on your phone that you rely upon for traffic updates, directions, the weather, instantaneous information and so on. Because it’s free, there’s no way to use prices — our willingness to pay for the good — as a measure of how much we value it.
As a result, GDP statistics won’t capture the benefits we gain from free apps, just as it has difficulties accounting for changes in the quality of goods over time.
And finally, the pseudo-experts are at it again, with plenty of ill-informed recession forecasts. I explain how to find real experts in this post. The market mispricing of recession probability may well be the biggest current trap for the average investor.
James Picerno also offers some great advice on this topic. Hint: Beware of those who cherry pick a few data points to serve their agenda.
The Week Ahead
We have a relatively quiet week for economic data. While I highlight the most important items, you can get an excellent comprehensive listing at Investing.com. You can filter for country, type of report, and other factors.
The “A List” includes the following:
- Employment report (F). Will recent strength continue?
- ISM index (M). Based on last week’s Chicago PMI, some see a move back above 50.
- Personal income and spending (M). Key take on households.
- ADP employment change (W). Good alternative to the “official.”
- Auto sales (T). Will the strength continue?
- Core PCE prices (M). The Fed’s favorite inflation measure has been very tame.
- Initial Claims (Th). The best concurrent news on employment trends, with emphasis on job losses.
The “B List” includes the following:
- ISM services (W). Not as established as the manufacturing index, but also important.
- Factory orders (Th). December data. Often volatile and recently weak.
- Construction spending (M). December data. Also volatile but recent strength.
- Productivity (Th). Q4 data, but important for GDP growth.
- Crude oil inventories (W). Attracting a lot more attention these days.
In the wake of the meeting, Fed speakers will be back in action. Expect questions about what they actually said and did they mean it? Corporate earnings reports will remain in the spotlight. News from around the world is a continuing wild card, with U.S. stock futures often showing big moves in pre-market trading.
And last but not least, there will finally be some actual Presidential voting in the Iowa caucuses on Monday.
How to Use the Weekly Data Updates
In the WTWA series I try to share what I am thinking as I prepare for the coming week. I write each post as if I were speaking directly to one of my clients. Each client is different, so I have five different programs ranging from very conservative bond ladders to very aggressive trading programs. It is not a “one size fits all” approach.
To get the maximum benefit from my updates you need to have a self-assessment of your objectives. Are you most interested in preserving wealth? Or like most of us, do you still need to create wealth? How much risk is right for your temperament and circumstances?
My weekly insights often suggest a different course of action depending upon your objectives and time frames. They also accurately describe what I am doing in the programs I manage.
Insight for Traders
We continue both the neutral market forecast, and the bearish lean. Felix increased from about 50% invested to 80% on Thursday. The more cautious Holmes is about 1/3 invested. For more information, I have posted a further description — Meet Felix and Oscar. You can sign up for Felix and Oscar’s weekly ratings updates via email to etf at newarc dot com. They appear almost every day at Scutify (follow here). I am trying to figure out a method to share some additional updates from Holmes.
Brett Steenbarger continues to deliver help to traders that they could not get anywhere else. We all know that psychology is important to our performance, but can we learn to use frustration as a positive factor?
To stay proactive, we need to use frustration as a cue to stop and reflect, not as a spur to act. Frustration can become our friend if it becomes our prod to improve who we are and what we do.
Insight for Investors
I review the themes here each week and refresh when needed. For investors, as we would expect, the key ideas may stay on the list longer than the updates for traders. Major market declines occur after business cycle peaks, sparked by severely declining earnings. Our methods are focused on limiting this risk. Start with our Tips for Individual Investors and follow the links.
We also have a page (recently updated) summarizing many of the current investor fears. If you read something scary, this is a good place to do some fact checking. Pick a topic and give it a try.
Many individual investors will also appreciate our two new free reports on Managing Risk and Value Investing. (Write to main at newarc dot com).
Other Advice
Here is our collection of great investor advice for this week.
If I had to pick a single most important source, it would be The Conversation’s discussion of psychology and whether negativity can generate a self-fulfilling prophecy. The article does a nice job of comparing economic facts with the anchoring biases of observers.
Stock and Fund Ideas
Barron’s has a cover story recommending bank stocks. They mention all of the big banks that you know and several regional choices that you might not. The regional banks include some of our holdings. I like the concept, and prefer regional names right now. They are not as much of a target for government, and you may also be able to dodge significant energy exposure.
Barron’s last roundtable issue has many stock ideas from their well-known participants. Even if you are not a regular subscriber, you might enjoy this issue. While I make my own decisions, I usually get some ideas that I have not seen elsewhere.
“Peak auto?” Some are wondering, but Ford had a breakout year. Joann Muller of Forbes takes a deeper look at the company’s report, including issues for 2016. Not only did Ford (N:F) have record profits and the best-selling vehicle in the U.S., the F-150 pickup. Some might be surprised at the strength in China sales.
Personal Finance
Professional investors and traders have been making Abnormal Returns a daily stop for over ten years. The average investor should make time (even if not able to read every day as I do) for a weekly trip on Wednesday. Tadas always has first-rate links for investors in this special edition. There are several great posts, but I especially liked this advice from Carl Richards of the New York Times. He emphasizes the importance of having a financial plan and sticking to it, tuning out the crazy forecasts.
Every year, right around this time, all the big brokerage firms, economists and banks come out with projections of what’s supposed to happen next in the financial world. This year is no exception. Especially prominent in the news has been the Royal Bank of Scotland warning, in no uncertain terms, that people should “sell everything” and prepare for a “fairly cataclysmic year ahead.”
You hear something like this from RBS, and it’s so clear, right? “Sell everything.” “Cataclysmic year.” Those aren’t vague terms. If you’re a normal human being, hearing news like this is disconcerting. A pit forms in your stomach, and you don’t know what to do. You certainly feel like you should be doing something, but what?
Fast-forward a few days. You’re thinking it over, trying to decide what to do, and you tune into the news again to see what RBS is suggesting. But you don’t hear from RBS. Instead, you get an update from Goldman Sachs. Goldman Sachs — and they’re smart too — reports that they see an 11 percent upside in the “S&P 500 after an ’emotional’ sell-off.”
China
Fears are exaggerated says Steve Roach, former Chairman of Morgan Stanley Asia. (False Alarm on China) The transition to a new growth model “does not spell an imminent crisis”.
Final Thoughts
I often wish that I could do a little test with market experts. They get to see the news for the day in advance – reported earnings, the text of Fed statements, whatever. From this information they must predict the closing market levels.
The results would be surprising to most. The certainty you hear in the day’s end news reports makes absolutely no sense. Wednesday was a great example. The evening news said that the Fed did not change a key interest rate and hinted that the pace of rate increases might be slower. (Fair enough). The second sentence said that the market was expecting more. No one knew that beforehand, despite countless hours spent discussing expectations.
When you are reporting the news you must try to “explain” everything, whether the fit is good or not. The Bank of Japan surprise interest rate cut is another example. Since markets rallied strongly after the announcement, most people inferred causality. It takes some creative thinking to make this into a huge positive story for U.S. stocks.
My conclusions are based on probability, not certainty. Stocks continue to trade with oil because the correlation is working. Economic data continue to show modest growth with recession odds very low. Corporate earnings are most important. With that backdrop, investors can makes some logical decisions. But they might not work right away!
No one knows whether the correction is over.

