The economic calendar is light and it is the start of the week-long Chinese New Year. This means some media time and space that must be filled. Needing an attention-getter, I expect the punditry to be asking:
Is a recession looming?
Prior Theme Recap
In my last WTWA I predicted that everyone would be talking about whether the stock market correction was over. That was one of the most frequent media topics for the week, especially at the lows on Wednesday and again on Friday. As expected, answers varied and we still don’t know for sure. You can see the early-week strength on the S&P 500, mid-week rebound, and Friday selling in Doug Short’s weekly chart, below. (With the ever-increasing effects from foreign markets, you should also add Doug’s World Markets Weekend Update to your reading list).
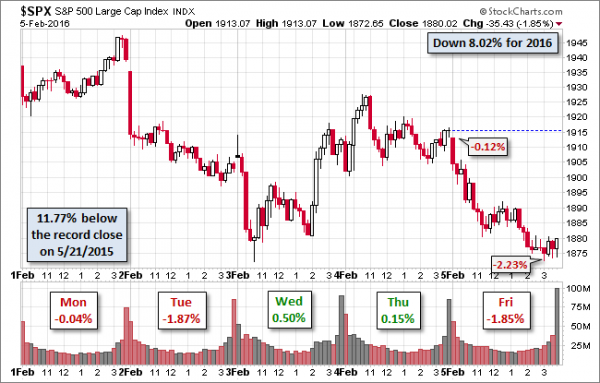
Doug’s update also provides multi-year context. See his full post for more excellent charts and analysis.
We would all like to know the direction of the market in advance. Good luck with that! Second best is planning what to look for and how to react. That is the purpose of considering possible themes for the week ahead. You can make your own predictions in the comments.
This Week’s Theme
Earnings season continues, but the economic calendar is light. Because of the Chinese New Year, we will not have stock or economic news from there. With plenty of recent economic data and scary forecasts to digest, pundits are pondering the worst. When that happens they ask everyone (regardless of qualifications) the same question:
Is a recession looming?
With economic data, especially in manufacturing, weaker than it was for most of 2015, many wonder what this portends. Listed below are popular bearish arguments from a variety of sources:
- The recession has already started.
- The stock market is clearly signaling recession.
- Falling commodity prices have signaled a recession.
- Declining oil prices have started a death spiral.
- China economic weakness will drag down the rest of the world.
- Emerging market weakness will drag down the rest of the world.
- Energy company bankruptcies will drag down banks.
- The Fed is out of bullets.
The bullish arguments are more concentrated in the economic community:
- The economy shows only modest growth, but not a recession.
- A U.S. recession has never resulted from global weakness.
- Historically reliable indicators do not show a recession.
- Key economic indicators followed in dating recessions have not peaked.
As always, I have my own opinion in the conclusion. But first, let us do our regular update of the last week’s news and data. Readers, especially those new to this series, will benefit from reading the background information.
Last Week’s Data
Each week I break down events into good and bad. Often there is “ugly” and on rare occasion something really good. My working definition of “good” has two components:
- The news is market-friendly. Our personal policy preferences are not relevant for this test. And especially – no politics.
- It is better than expectations.
The Good
On balance the news tilted to the negative side last week, but there were a few bright spots.
- Federal receipts (and spending) are 3% higher. This is usually a positive economic sign. (CBO via GEI).
- The Fed may be walking back the tough talk from last month. (Tim Duy).
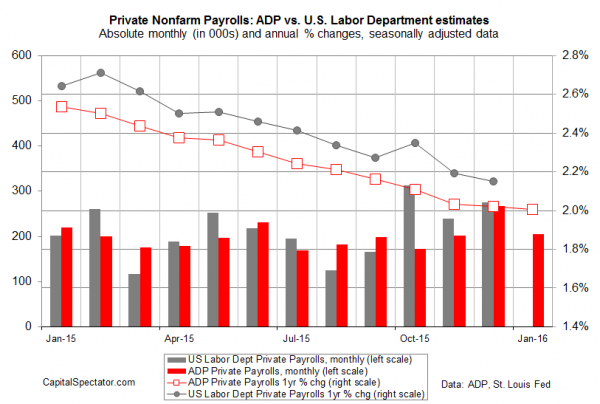
- Private payrolls grew by 205K according to the ADP report. James Picerno notes that while the level is solid, the pace is declining.
The Bad
Most of the economic data tilted negative.
- Earnings reports have disappointed. Even growth ex-energy is only 2.1% and sales growth barely positive. Earnings expert Brian Gilmartin provides data, analysis as well as a look at forward earnings. Bespoke notes that the overall stock reaction on earnings day has been slightly positive. Take a look at their lists of the biggest winners and losers.
- ISM manufacturing was about as expected at 48.2, but it is the fourth consecutive month below 50.
- ISM services remained in expansion at 53.5, but that was slightly lower than expectations.
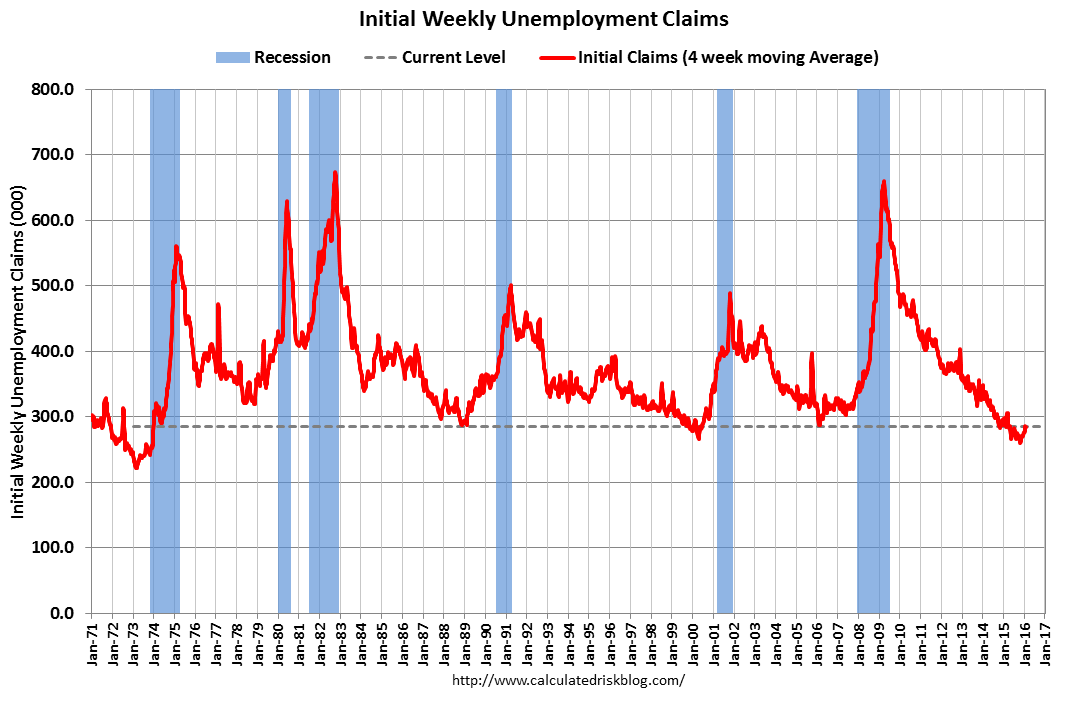
- Initial jobless claims edged higher, but Calculated Risk notes the level is still not bad.
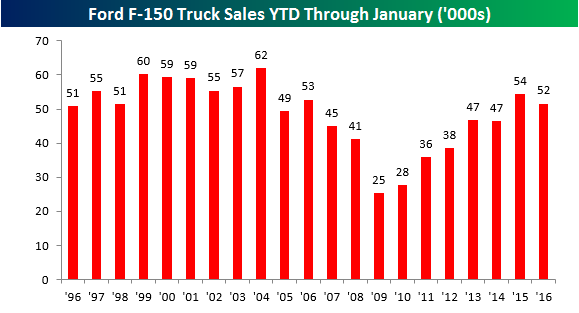
- Ford (N:F) F150 sales were down 5% on a year-over-year basis. It is still the best-selling U.S. vehicle, and is also popular with construction companies and small businesses, which is why I watch it as an economic indicator.
- Employment gains disappointed, at least on the overall non-farm payroll gain. The story was actually mixed, since the unemployment rate and earnings were both higher. Everyone should remember that the “headline number” has an error band of over 100K, even after revisions. I like the WSJ summary of the report, featuring twelve charts.
The Ugly
Martin Shkreli. His smirking non-testimony before a House committee was bad enough to make the Representatives seem attractive by comparison. My concern? A rational debate on drug pricing is needed. Between this guy and the candidates, we can expect months before this will happen. Meanwhile, what about the drugs that deserve investment — right now.
The Silver Bullet
I occasionally give the Silver Bullet award to someone who takes up an unpopular or thankless cause, doing the real work to demonstrate the facts. Think of The Lone Ranger. This week’s award goes to Paul Hickey of Bespoke Investment (via Pradip Sigdyal of CNBC). Over the last few years we have frequently heard about high margin debt on the NYSE. The argument was that the degree of leverage signaled danger. The accompanying charts seemed to show coincident peaks, but people saw what they wanted to see.
Although declining margin levels are often cited as a bearish signal for the market, Hickey believes that it is a small concern given the indicator’s coincidental nature. On the other hand, the prospect of rising rates spooks investors much more, and holds them back from buying stocks.
“Margin debt rises when the market rises and falls when the market falls,” Hickey said. “If you look at the S&P 500’s average returns after periods when margin debt falls 10 percent from a record high, the forward returns aren’t much different than the overall returns for all periods.”
Quant Corner
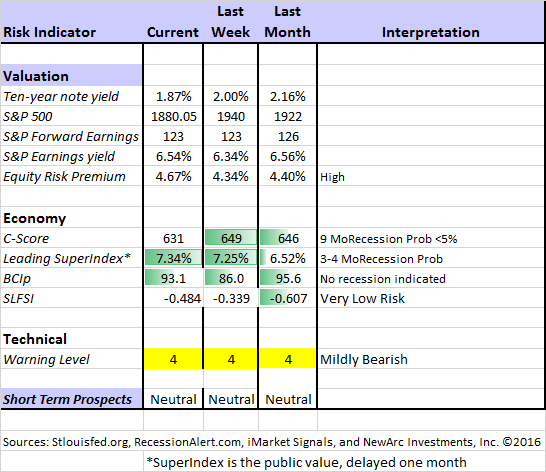
Whether a trader or an investor, you need to understand risk. I monitor many quantitative reports and highlight the best methods in this weekly update. Beginning last week I made some changes in our regular table, separating three different ways of considering risk. For valuation I report the equity risk premium. This is the difference between what we expect stocks to earn in the next twelve months and the return from the 10-Year Treasury note. I have found this approach to be an effective method for measuring market perception of stock risk. This is now easier to monitor because of the excellent work of Brian Gilmartin, whose analysis of the Thomson-Reuters data is our principal source for forward earnings.
Our economic risk indicators have not changed.
In our monitoring of market technical risk, I am now using our new model, “Holmes”. Holmes is a friendly watchdog in the same tradition as Oscar and Felix, but with a stronger emphasis on asset protection. We have found that the overall market indication is very helpful for those investing or trading individual stocks. The score ranges from 1 to 5, with 5 representing a high warning level. The 2-4 range is acceptable for stock trading, with various levels of caution.
The new approach improves trading results by taking some profits during good times and getting out of the market when technical risk is high. This is not market timing as we normally think of it. It is not an effort to pick tops and bottoms and it does not go short.
Interested readers can get the program description as part of our new package of free reports, including information on risk control and value investing. (Send requests to main at newarc dot com).
In my continuing effort to provide an effective investor summary of the most important economic data I have added Georg Vrba’s Business Cycle Index, which we have frequently cited in this space. In contrast to the ECRI “black box” approach, Georg provides a full description of the model and the components.
For more information on each source, check here.
Recent Expert Commentary on Recession Odds and Market Trends
Bob Dieli does a monthly update (subscription required) after the employment report and also a monthly overview analysis. He follows many concurrent indicators to supplement our featured “C Score.”
Georg Vrba: provides an array of interesting systems. Check out his site for the full story. We especially like his unemployment rate recession indicator, confirming that there is no recession signal. He gets a similar result with the twenty-week forward look from the Business Cycle Indicator, updated weekly and now part of our featured indicators.
Doug Short: Provides an array of important economic updates including the best charts around. One of these is monitoring the ECRI’s business cycle analysis, as his associate Jill Mislinski does in this week’s update. His Big Four update is the single best visual update of the indicators used in official recession dating. You can see each element and the aggregate, along with a table of the data. The full article is loaded with charts and analysis.
RecessionAlert: A variety of strong quantitative indicators for both economic and market analysis. While we feature the recession analysis, Dwaine also has a number of interesting systems. These include approaches helpful in both economic and market timing. He has been very accurate in helping people to stay on the right side of the market.
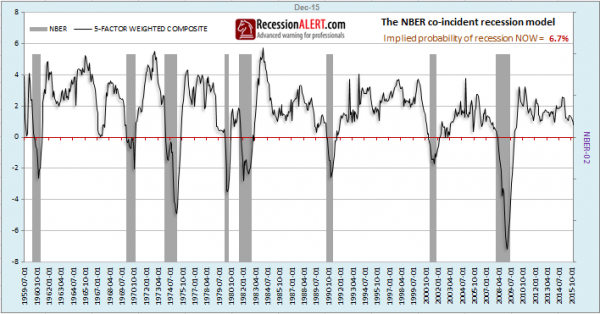
Dwaine has a new article providing a first-rate analysis of various recession indicators. It is well worth a careful read and a study of the charts. Here is his conclusion, and a chart showing his version of the “Big Four” indicators.
To summarize, despite many pockets of disconcerting co-incident indicator weakness, many brought on by the energy and commodities complex, the risk of near-term recession appears low. Although many short-leading indicators are showing recession there are not enough of them yet to warrant a confident recession call. What remains highly elusive is finding long-leading data that points to recession.
Recession odds are rising, as is commentary surrounding recession. Most of this commentary centers around “cherry picking” this or that indicator or sector to bolster an argument but rarely covers broad-based assessments.
Peterson Institute and Market Valuation
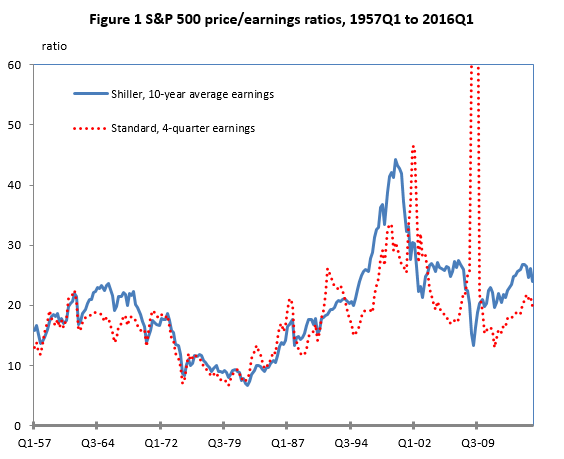
I regard the equity risk premium from the Indicator Snapshot table as an important measure of market perceptions about the economy and earnings. A problem with many discussions of stock valuation is that they completely ignore expected inflation and interest rates. Olivier Blanchard and Joseph E. Gagnon, both top economists with many years of relevant experience, now at the Peterson Institute for International Economics, clearly explain this point.
…(T)he deviations of the P/E from its historical average are in fact quite modest. But suppose that we see them as significant, that we believe they indicate the expected return on stocks is unusually low relative to history. Is it low with respect to the expected return on other assets? A central aspect of the crisis has been the decrease in the interest rate on bonds, short and long. According to the yield curve, interest rates are expected to remain quite low for the foreseeable future. The expected return on stocks may be lower than it used to be, but so is the expected return on bonds.
The way to make progress is to compute expected returns on stocks and bonds, and look at the equity premium, pre- and post-crisis. With this in mind, table 1 compares expected real returns on stocks, constructed in three different ways, with expected real returns on bonds, constructed in two different ways. To smooth out temporary fluctuations, the measures are based on averages of four quarterly values in each year. We compare expected returns as of 2015 with those of 2005, a time when there was little concern about overvaluation in stock prices. Our results would be similar if we had compared with any year in the mid-2000s.
You can debate how much of an adjustment to make for interest rates, but not whether some consideration is needed.
The Week Ahead
We have a relatively quiet week for economic data. While I highlight the most important items, you can get an excellent comprehensive listing at Investing.com. You can filter for country, type of report, and other factors.
The “A List” includes the following:
- Retail sales (F). Any sign of life in this important indicator?
- Michigan sentiment (F). Important concurrent read on employment and spending – a bit off of the peak.
- Initial Claims (Th). The best concurrent news on employment trends, with emphasis on job losses.
The “B List” includes the following:
- Wholesale inventories (T). Volatile December data has GDP impact.
- Business inventories (F). See wholesale inventories.
- Crude oil inventories (W). Attracting a lot more attention these days.
Fed Chair Yellen testifies about the economy – Wednesday the House Financial Services Committee and Thursday the Senate Banking Committee. The statement will be the same, but the questions will be different. Market observers will be searching for hints about a changed attitude since the last Fed meeting.
Tuesday’s New Hampshire primary will have a big impact on the prospects for candidates, but probably not much market impact. Things will get more interesting when the primaries move on to different regions and larger states.
Earnings reports will also remain important.
How to Use the Weekly Data Updates
In the WTWA series I try to share what I am thinking as I prepare for the coming week. I write each post as if I were speaking directly to one of my clients. Each client is different, so I have six different programs ranging from very conservative bond ladders to very aggressive trading programs. It is not a “one size fits all” approach.
To get the maximum benefit from my updates you need to have a self-assessment of your objectives. Are you most interested in preserving wealth? Or like most of us, do you still need to create wealth? How much risk is right for your temperament and circumstances?
WTWA often suggests a different course of action depending upon your objectives and time frames.
Insight for Traders
We continue both the neutral market forecast, and the bearish lean. Felix increased from about 80% invested to 100%, but 2/3 is in foreign ETFs. The more cautious Holmes is about 1/3 invested. For more information, I have posted a further description — Meet Felix and Oscar. You can sign up for Felix and Oscar’s weekly ratings updates via email to etf at newarc dot com. They appear almost every day at Scutify (follow here). I am trying to figure out a method to share some additional updates from Holmes, our new portfolio watchdog.
Hedge funds are hiring poker pros. (When I started in the business it was bridge players). The analysis of risk and reward combined with speedy decision making is common to both. Garrett Baldwin has an interesting and informative article as part of a series.
Brett Steenbarger continues to deliver help to traders that they could not get anywhere else. His seven tips for getting to the next level are quite helpful. I especially like #1.
1) My profitability has improved since I’ve focused on consistency rather than profitability. I’ve honed in on what are good trades for me and where my profits have come from. I just want to be consistent in trading those good trades. If I can do that, the profitability will come. And if I want greater profitability, I should size up the good trades, not take other, more marginal trades.
Insight for Investors
I review the themes here each week and refresh when needed. For investors, as we would expect, the key ideas may stay on the list longer than the updates for traders. Major market declines occur after business cycle peaks, sparked by severely declining earnings. Our methods are focused on limiting this risk. Start with our Tips for Individual Investors and follow the links.
We also have a page (recently updated) summarizing many of the current investor fears. If you read something scary, this is a good place to do some fact checking. Pick a topic and give it a try.
Many individual investors will also appreciate our two new free reports on Managing Risk and Value Investing. (Write to main at newarc dot com).
Other Advice
Here is our collection of great investor advice for this week:
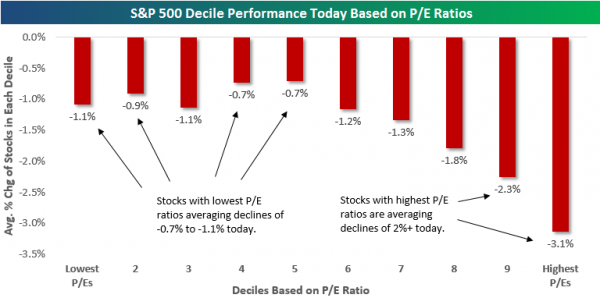
If I had to pick a single most important source for investors to read, it would be a short but important post. Bespoke shows what can happen to high multiple stocks, using data from this earnings season.
This naturally raises the question of how you can avoid such disasters. I recommend using Chuck Carnevale’s F.A.S.T. Graph tool. Here is an example of what you could learn:
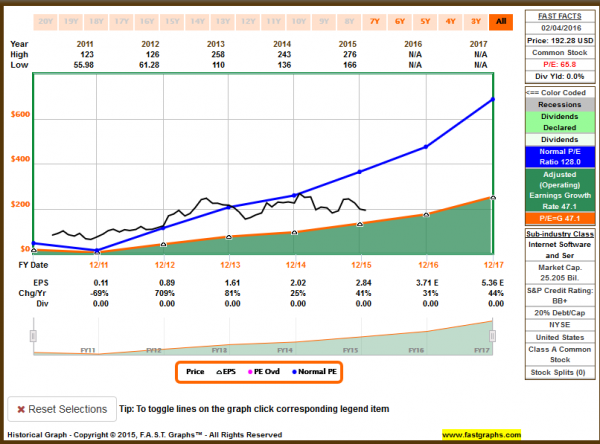
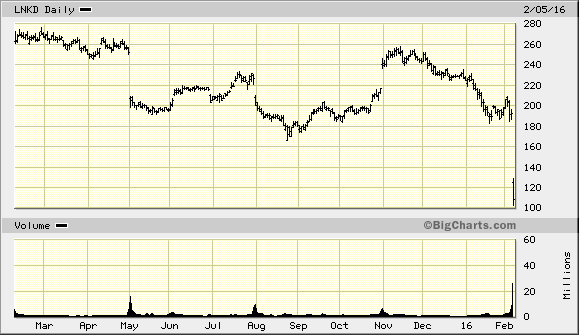
Helping you to avoid this 45% haircut:
Stock and Fund Ideas
Apple (O:AAPL) is frequently recommended as a cheap stock. Charles Sizemore goes beyond the typical arguments in concluding that “It’s ridiculous!”
Master Limited Partnerships (MLPs) may still have plenty of downside. (Kevin Kaiser via Barron’s)
Resource prices may have bottomed says Jeremy Grantham (!) in the analysis of the positives from low oil prices.
Interpreting Research Results
The Psy-Fi Blog explains the weakness in most current stock research.
Here’s what ought to be a really boring idea – we need scientists in general and psychologists and economists in particular to stop hypothesising after results are known (HARKing, geddit?). Instead they need to state what they’re looking for before they conduct their experiments because otherwise they cherrypick the results they find to confirm hypotheses they never previously had.
By coincidence, I wrote a similar post on the same day. My emphasis is on how costly it is to insist on some post-hoc explanation of surprising phenomena.
Personal Finance
Professional investors and traders have been making Abnormal Returns a daily stop for over ten years. The average investor should make time (even if not able to read every day as I do) for a weekly trip on Wednesday. Tadas always has first-rate links for investors in this special edition. There are several great posts, but I especially liked this advice unconventional advice from Allison Schrager – you might not always want to max out your 401K contribution. The article provides a good analysis of key factors in retirement planning, and the tradeoff with keeping some emergency cash.
Final Thoughts
My weekly prediction (guess?) for WTWA typically raises a theme question with a variety of possible answers. Even if it is the topic of the week, it is often not resolved. I offer my own conclusions, but sometimes do not have a strong opinion.
This week is different. My extensive research into the best methods for recession forecasting provides the basis for some confidence. The methods I highlight have worked the well, and done so for a long time.
The market is pricing in recession odds of nearly 50%. There are so many negative headlines, often misleading.
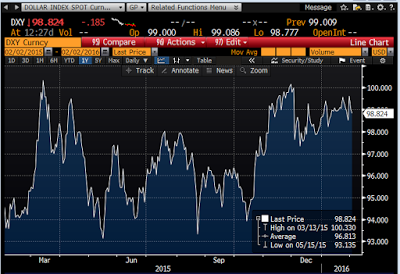
The “Oilmageddon” term coined by some Citi analysts captured the headlines. You had to read to the very end of the articles to see that this is something they suggested might happen. (CNBC interview). Their actual prediction was that it would probably be avoided by some appropriate policy adjustments. Scott Grannis notes that such problems are usually self-correcting and suggests that the best policy would be to get out of the way. Those predicting the inevitable increase of the dollar would do well to consider this chart:
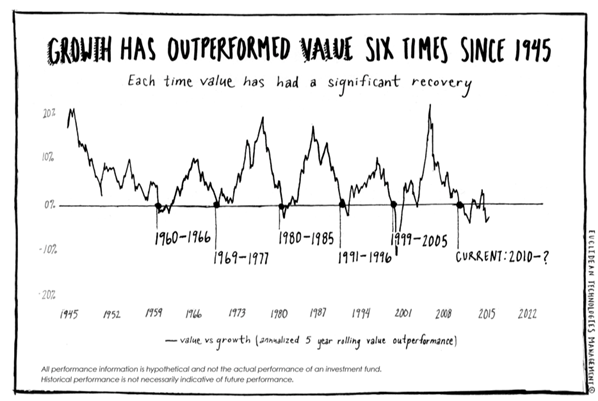
In sharp contrast, the best sources see recession odds of 10% or lower. This is the greatest opportunity left in this business cycle, since you can buy many value stocks with single-digit multiples. Great analysis from John Alberg and Michael Seckler (via Advisor Perspectives—read by advisors, but also interesting for individual investors).
Everyone wants to know when to expect the value rebound. I do not expect a single, mind-changing event. This is a change that will happen gradually, as evidence is reflected in higher earnings.

