The economic calendar is moderate. Fed Heads are mostly on the bench. The Doha oil conference (combining OPEC and non-OPEC producers) will be the first major news for the week ahead. Markets have already anticipated the outcome, just as they have the trend of first-quarter earnings. It is a classic test of the theme:
Is it time to sell the news?
Prior Theme Recap
In my last WTWA I predicted special attention to corporate earnings reports and a possible break of the trading range. The first part was true throughout the week, and the second part was in play on Friday. Doug Short comments on the S&P 500's increased volatility and also notes the good overall week and the volume spike on options expiration. See his discussion and context as well as his excellent weekly chart. (With the ever-increasing effects from foreign markets, you should also add Doug’s World Markets Weekend Update to your reading list).
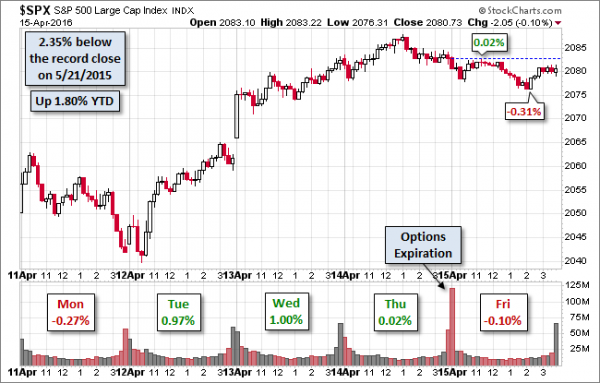
Doug’s update also provides multi-year context. See his full post for more excellent charts and analysis.
We would all like to know the direction of the market in advance. Good luck with that! Second best is planning what to look for and how to react. That is the purpose of considering possible themes for the week ahead. You can make your own predictions in the comments.
This Week’s Theme
The economic calendar is moderate. There are few scheduled Fed distractions. Earnings season will be in full swing. This reporting period might be the most important in recent years.
Last week gave us a preview. The talking heads at pundit central were constantly asking why the market moved higher in the face of moderate or bad news on the “fundamentals.” At the start of the week–and maybe by the time you read this—the Doha outcome will be known. By week’s end we will have much more information on earnings. Both themes set up the popular question for next week:
Is it time for investors to “sell the news?”
Background
My approach to introducing this week’s theme was to discuss the Iraq War and the non-stop CNBC coverage of Iraqis pulling down a statue of Saddam Hussein, basically with no tools. (Some believe that the whole thing was staged, making it an especially good example for my purpose). Futures had popped at the opening. It took an hour or so for the statue to come down. What do you think was the result?
Mrs. OldProf advises me that this example is boring and pedantic (who, me?) She recommends instead a song that was (amazingly) written in fifteen minutes by Carly Simon. If Cat Stevens had been on time for their date, the song might not ever have been written!
We can never know about the days to come
But we think about them anyway, yay
And I wonder if I’m really with you now
Or just chasin’ after some finer dayAnticipation, anticipation
Is makin’ me late
Viewpoints
The basic themes, moving from bearish to bullish, are as follows:
- Stocks have increased dramatically for no apparent reason. It is a classic time to sell.
- Doha expectations make no sense. The “positive” side has been built into expectations. A likely negative outcome will hit oil prices, the recent correlate for all risk-on assets.
- Earnings achieved the customary result – beating dramatically lowered expectations. It means nothing.
- Economic data remain weak and international threats abound.
- The earnings recession is upon us. Outlook updates have been poor. Expect an over-valued market to crash.
- Strength in the face of mediocre news is a positive. Next step? Breaking the trading range.
- The bad news has been “baked in.” Perceptions of fundamentals are pretty negative. A weaker dollar will help.
These viewpoints have all been vigorously expressed in recent days, but my sense is that short-term traders remain pessimistic about both earnings and energy prices.
As always, I have my own opinion in the conclusion. But first, let us do our regular update of the last week’s news and data. Readers, especially those new to this series, will benefit from reading the background information.
Last Week’s Data
Each week I break down events into good and bad. Often there is an “ugly” and on rare occasion something really good. My working definition of “good” has two components:
- The news is market-friendly. Our personal policy preferences are not relevant for this test. And especially – no politics.
- It is better than expectations.
The Good
There was a little good news.
- The CPI remains low and gradually rising — 0.1% on both headline and core.
- The crude oil “glut” is narrowing. “Davidson” (via Todd Sullivan) notes the narrowing of the 1% gap between supply and demand. He cites various sources suggesting that the gap is narrowing – a massive change in perceptions from the IEA in only a few weeks. The significance?
Long leading indicators have improved, although the overall picture is still mixed. (New Deal Democrat).What this says is that most of what one hears is tied to trends in oil prices and not to fundamentals. The behavior of the majority of investors, perhaps more than 95% of investors, is to assume that price trends carry economic information and then look to determine which fundamentals they think are responsible. Herd mentality is always a strong force when individuals do not know how to read fundamental data.
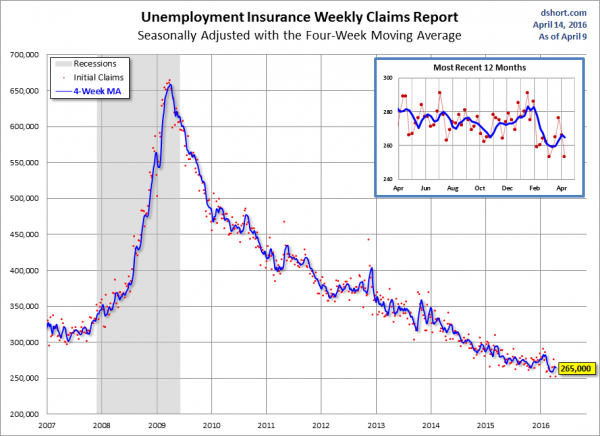
- Jobless claims down ticked to 253K, beating last week and also expectations by a solid margin. Doug Short and Jill Mislinski have analysis and one of his amazing charts that combines short term, long term, recessions, two time frames, each weekly result, and the four-week moving average.
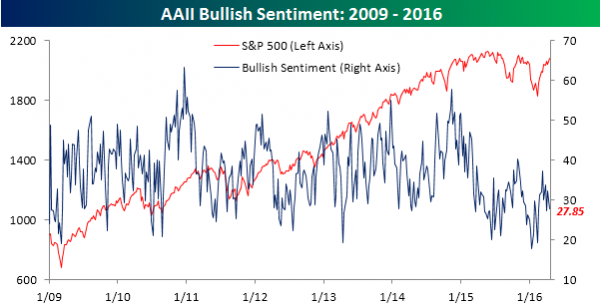
- Bullish sentiment moves even lower despite recent market gains. (Bespoke).
The Bad
Most of the news was negative.
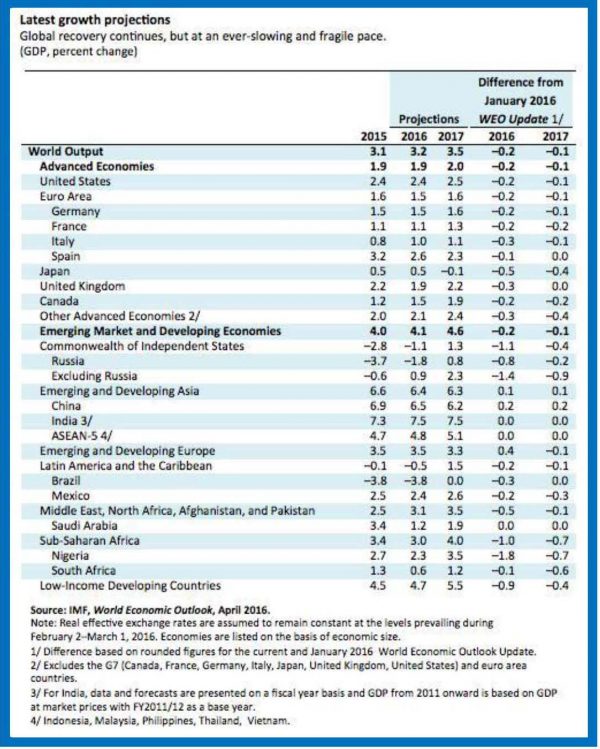
- IMF downgrades estimates for the world economy. Menzie Chinn explains and provides this chart:
- Several big banks fail the “living will” test. (Reuters)
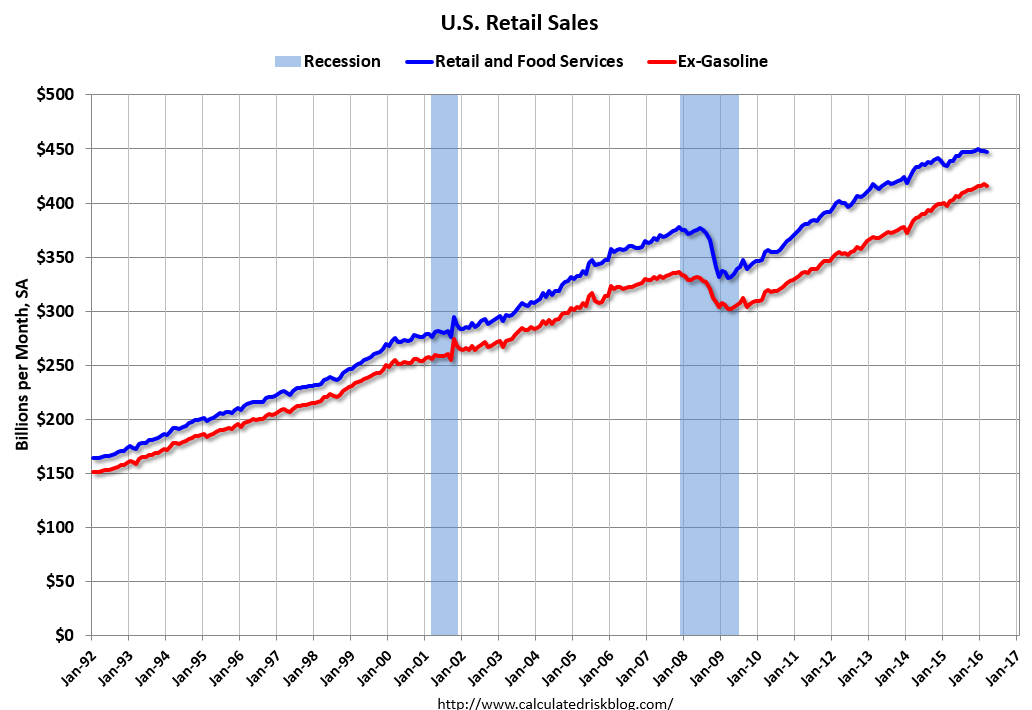
- Retail sales disappointed, dropping 0.3 % (0.4 ex-gasoline). Calculated Risk elaborates.
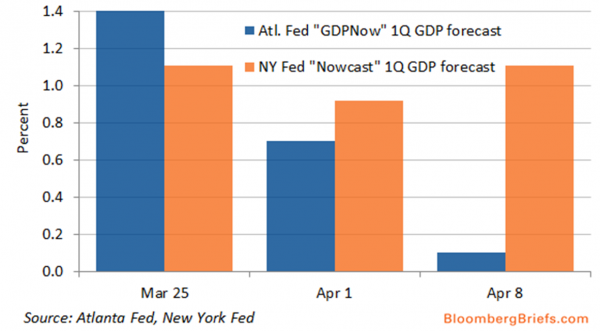
- U.S. Q116 GDP downgrades continue. The NY Fed has now joined Atlanta in doing a rapid update of current GDP. Other central banks discuss business conditions, but not attempting a specific forecast. The official GDP data comes much more slowly after revisions from the underlying sources are complete and a benchmarking process followed. Do the fast techniques cut some corners? How good are these estimates? Barry Ritholtz has a skeptical take on this process, reminding us:
The old joke seems to apply here: Do you want it fast, cheap or good? Pick two.
- Industrial production fell 0.6%, slightly lower than the prior month and badly missing expectations of “unchanged.” Steven Hansen looks at the data using his customary wide array of methods.
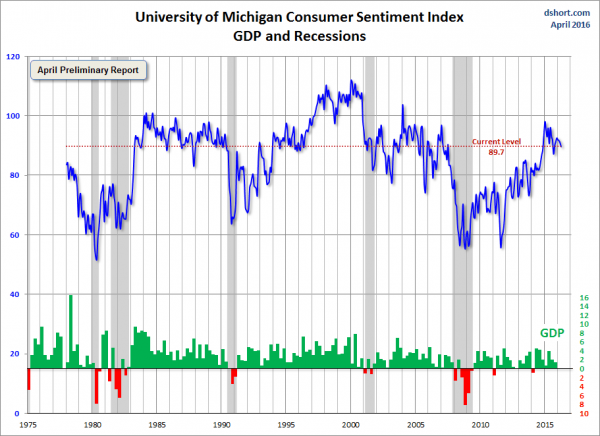
- Michigan sentiment of 89.7 (preliminary reading) was down 1.3 from the March final and missed expectations by 2.3 points. Doug Short associate Jill Mislinski has a comprehensive review, quoting the Survey’s economist Richard Curtin.
None of these declines indicate an impending recession, although concerns have risen about the resilience of consumers in the months ahead. Consumers reported a slowdown in expected wage gains, weakening inflation-adjusted income expectations, and growing concerns that slowing economic growth would reduce the pace of job creation. These apprehensions should ease as the economy rebounds from its dismal start in the first quarter of 2016. Overall, the data now indicate that inflation-adjusted personal consumption expenditures will grow by 2.5% in 2016.
The Ugly
The IRS is especially vulnerable to hackers (Robert Hackett, Fortune). Few know that the IRS has about one million cyberattacks per day! One IRS employee, charged with helping those whose identity had been stolen, actually helped the hackers.
Is it time to refocus priorities? Perhaps increase appropriations? My sense is that many government computers are old and vulnerable.
The Silver Bullet
I occasionally give the Silver Bullet award to someone who takes up an unpopular or thankless cause, doing the real work to demonstrate the facts. Think of The Lone Ranger. This week’s award goes to Steve Saville who exposed the bogus, fear-inducing post at everyone’s favorite disaster site. The article about an emergency Fed meeting followed by a Yellen conference with both the President and Vice-President probably caused many individual investors to exit the market and got traders on the wrong side. The latter group may have covered quickly. They needed to.
The Fed mythology preys upon people’s greatest fears. Saville cites a Bloomberg article in November on the same theme. These are absolutely routine meetings where the Governors consider suggestions from the regional Presidents.
You need to be a real expert to know the difference between “expedited procedures” and “emergency.”
Quant Corner
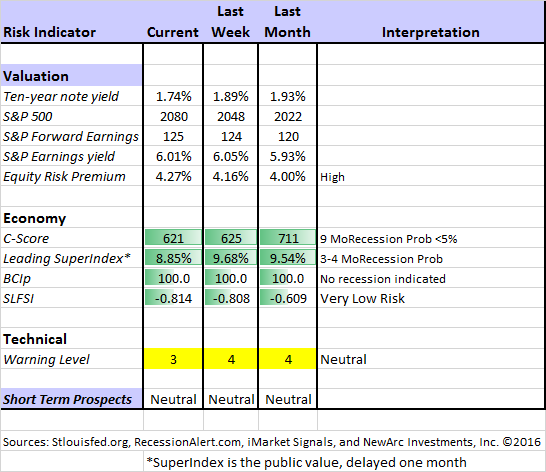
Whether a trader or an investor, you need to understand risk. I monitor many quantitative reports and highlight the best methods in this weekly update. Beginning last week I made some changes in our regular table, separating three different ways of considering risk. For valuation I report the equity risk premium. This is the difference between what we expect stocks to earn in the next twelve months and the return from the ten-year Treasury note. I have found this approach to be an effective method for measuring market perception of stock risk. This is now easier to monitor because of the excellent work of Brian Gilmartin, whose analysis of the Thomson-Reuters data is our principal source for forward earnings.
Our economic risk indicators have not changed.
In our monitoring of market technical risk, I am now using our new model, “Holmes”. Holmes is a friendly watchdog in the same tradition as Oscar and Felix, but with a stronger emphasis on asset protection. We have found that the overall market indication is very helpful for those investing or trading individual stocks. The score ranges from 1 to 5, with 5 representing a high warning level. The 2-4 range is acceptable for stock trading, with various levels of caution.
The Holmes risk indicator improved from “mildly bearish” to “neutral”. We score this as 3 rather than 4 in the table.
The new approach improves trading results by taking some profits during good times and getting out of the market when technical risk is high. This is not market timing as we normally think of it. It is not an effort to pick tops and bottoms and it does not go short.
Interested readers can get the program description as part of our new package of free reports, including information on risk control and value investing. (Send requests to info at newarc dot com).
In my continuing effort to provide an effective investor summary of the most important economic data I have added Georg Vrba’s Business Cycle Index, which we have frequently cited in this space. In contrast to the ECRI “black box” approach, Georg provides a full description of the model and the components.
For more information on each source, check here.
Recent Expert Commentary on Recession Odds and Market Trends
Georg Vrba: provides an array of interesting systems. Check out his site for the full story. We especially like his unemployment rate recession indicator, confirming that there is no recession signal. He gets a similar result with the twenty-week forward look from the Business Cycle Indicator, updated weekly and now part of our featured indicators.
Doug Short: Provides an array of important economic updates including the best charts around. One of these is monitoring the ECRI’s business cycle analysis, as his associate Jill Mislinski does in this week’s update. She cites a recent speech by ECRI co-founder Lakshman Acuthan who notes that the current business cycle is a “Grand Experiment” but with flawed assumptions. The review of the ECRI is comprehensive and provides an interesting comparison with Recession Alert, one of our featured sources. Chart lovers will love this regularly updated article.
Doug’s Big Four update is the single best visual review of the indicators used in official recession dating. You can see each element and the aggregate, along with a table of the data. The full article is loaded with charts and analysis. As you can see, the indicators show a mixed picture, but not the conditions for a recession.
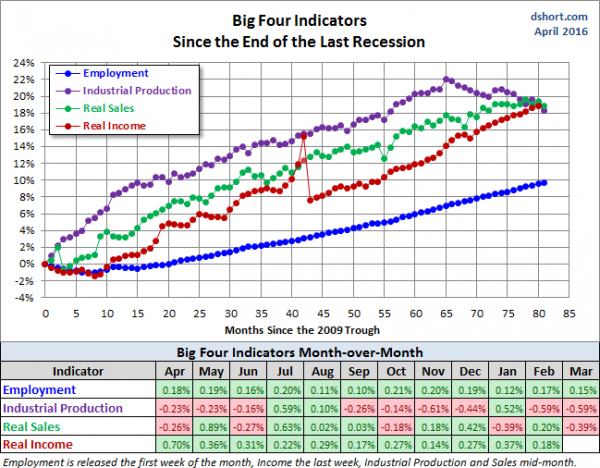
Bob Dieli does a monthly update (subscription required) after the employment report and also a monthly overview analysis. He follows many concurrent indicators to supplement our featured “C Score.”
RecessionAlert: A variety of strong quantitative indicators for both economic and market analysis. While we feature the recession analysis, Dwaine also has a number of interesting systems. These include approaches helpful in both economic and market timing. He has been very accurate in helping people to stay on the right side of the market. This week Dwaine has an update on the labor market which he describes as “not as strong as you think.”
The Week Ahead
We have an average week for economic data, with an emphasis on housing reports. While I highlight the most important items, you can get an excellent comprehensive listing at Investing.com. You can filter for country, type of report, and other factors.
The “A List” includes the following:
- Building permits and housing starts (T). Housing, especially new homes, remain as a crucial sector. Rebound continuing?
- Leading indicators (Th). A solid increase is expected. Many follow this report, despite various changes in calculation methods.
- Initial claims (Th). The best concurrent indicator for employment trends.
The “B List” includes the following:
- Existing home sales (W). Less immediate economic impact, but still helpful as a read on an important sector. A further rebound expected.
- Philly Fed (Th). One of two regional indexes worth watching. I remain unconvinced about the fundamental basis, but the markets react.
- Crude oil inventories (W). Attracting a lot more attention these days.
There is not much FedSpeak. We may start with a hangover from options expiration.
There will be a continuing focus on corporate earnings!
How to Use the Weekly Data Updates
In the WTWA series I try to share what I am thinking as I prepare for the coming week. I write each post as if I were speaking directly to one of my clients. Each client is different, so I have six different programs ranging from very conservative bond ladders to very aggressive trading programs. It is not a “one size fits all” approach.
To get the maximum benefit from my updates you need to have a self-assessment of your objectives. Are you most interested in preserving wealth? Or like most of us, do you still need to create wealth? How much risk is right for your temperament and circumstances?
WTWA often suggests a different course of action depending upon your objectives and time frames.
Insight for Traders
We continue both the neutral market forecast, but our overall rating moved to “neutral” from “mildly bearish”. Felix is still 100% invested. The more cautious Holmes continues to better the market while taking a lot less risk and is now back to 100% invested.
Holmes uses a universe of nearly 1000 stocks, selected mostly by liquidity. Even when the overall market is neutral, there will often be some strong candidates. Holmes holds a maximum of 16 positions at one time. For more information about Felix, I have posted a further description — Meet Felix and Oscar. You can sign up for Felix and Oscar’s weekly ratings updates via email to etf at newarc dot com. They appear almost every day at Scutify (follow here). I am trying to figure out a method to share some additional updates from Holmes, our new portfolio watchdog. (You learn more about Holmes by writing to info at newarc dot com.
Dr. Brett keeps bringing it, week after week. Do you have an R&D program?
Insight for Investors
I review the themes here each week and refresh when needed. For investors, as we would expect, the key ideas may stay on the list longer than the updates for traders. Major market declines occur after business cycle peaks, sparked by severely declining earnings. Our methods are focused on limiting this risk. Start with our Tips for Individual Investors and follow the links.
We also have a page summarizing many of the current investor fears. If you read something scary, this is a good place to do some fact checking. Pick a topic and give it a try. Feel free to suggest new topics if your “fear” is not on the list.
Many individual investors will also appreciate our two new free reports on Managing Risk and Value Investing. (Write to info at newarc dot com).
Other Advice
Here is our collection of great investor advice for this week. It was especially difficult to screen for WTWA since there were so many good articles. Please enjoy!
If I had to pick a single most important source for investors to read, it would be David Foulke’s post at Alpha Architect. The new rules on fiduciary responsibilities for investment advisors are confusing to many. He provides a helpful quiz showing the hidden brokerage and insurance links obscured by several popular advertisements. This is both entertaining and extremely valuable.
Stock Ideas
10 mid-cap stocks from Chuck Carnevale’s screening. He demonstrates that all have plenty of upside.
Eddy Elfenbein identifies twelve stocks with sales growth over 60 straight quarters.
Barron’s has auto news on the cover (25% upside?) and feature stories on both Ford (NYSE:F) and General Motors (NYSE:GM). (Makes sense to me).
Strategy
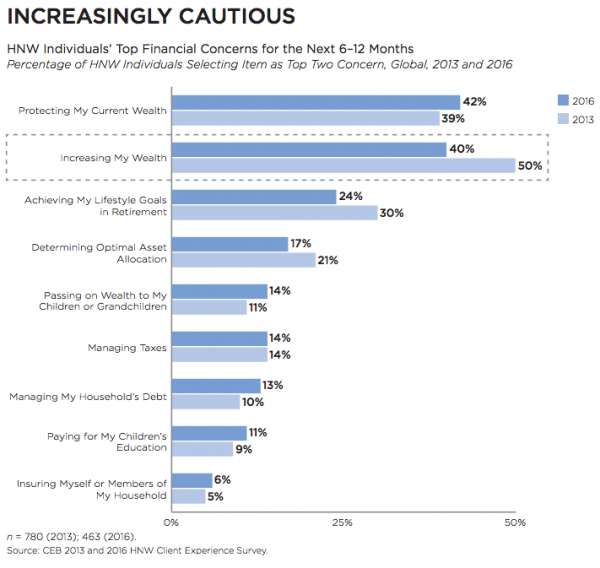
It all starts with setting your goals. Ben Carlson shows that investors want to protect wealth. But they also want to increase it. It is a dual mandate that is difficult for many to navigate on their own.
Personal Finance
Professional investors and traders have been making Abnormal Returns a daily stop for over ten years. The average investor should make time (even if not able to read AR every day as I do) for a weekly trip on Wednesday. Tadas always has first-rate links for investors in this special edition. There are several great posts, but I especially liked the advice about The “Rosemary’s Baby” of Investment Products by Tony Isola. He explains well the drawbacks from indexed annuities, a popular current “product”:
So when all is said and done, fixed-index annuity investors receive the following:
Bond like returns with many unnecessary layers of complexity
Hedge fund like fees.
Steep surrender charges greatly reducing liquidity. Translation, you can’t sell this crap when you might need to.
Counter party risk that is unnecessary. Since you are transferring your risk to an insurance company, an investor is at the mercy of the insurer’s financial situation. Insurance companies can go bankrupt.
The upside is capped and often reset. This means the market can go up 15% but an investor’s maximum gain may be 5%!
And also:
There is no chance you will travel faster than the guy next to you if you are rowing against the current and he isn’t. When it comes to fixed-indexed annuities, the current is twice as strong.
High fees and the exclusion of dividends will literally sink your investment boat before the race even starts.
[Jeff] It is difficult to help people who have purchased these products. The sales agent has gotten signatures on disclosures that are densely written and difficult to interpret. This advice is important for many investors who are encouraged to think that all problems are solved with this approach. It can be fine for some investors, but they need a guide not prepared by the salesman. As Mr. Buffett notes: Don’t ask your barber if you need a haircut!
Commodities
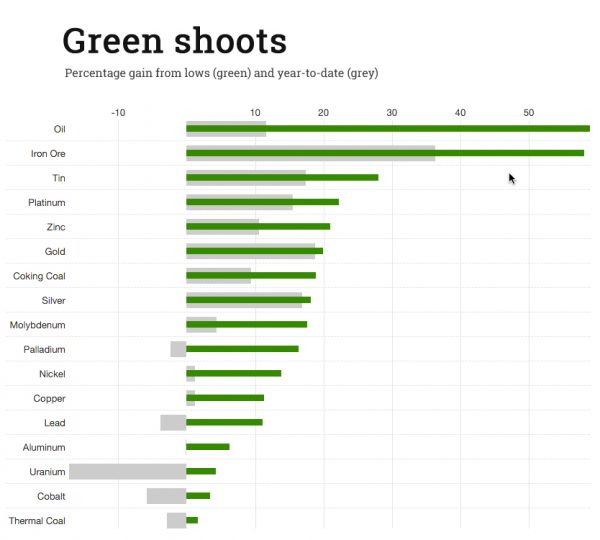
Have we made a bottom in commodities? BHP Billiton (NYSE:BHP) chief executive Andrew Mackenzie has an upbeat take on commodity prices, believing the worst may be over. The Pundit-in-Chief dismisses the evidence from Billiton’s model. What do you think?
Watch out for….
Active bond funds with (apparently) high returns. Pimco executive Dan Ivascyn explains:
“Investors are gravitating toward income-generating high dividend ETFs which sometimes don’t have restrictions on lower credit quality.”
Larry Swedroe elaborates in discussing Unconstrained Mutual Funds, writing as follows:
Unconstrained mutual funds are permitted to own global bonds, currencies, high-yield bonds, structured bonds and even equities. Many utilize leverage, derivatives and swaps, taking short positions as well as long ones. In other words, in addition to their typically high expense ratios, unconstrained funds are often highly complex. Unfortunately, complexity often carries risks that may offset the very risk-reducing benefits bond investors seek and dilute fixed income’s role as a portfolio’s primary risk-mitigating component.
As one example of the risks involved, Morningstar data shows that as of year-end 2014, the average fund in the “unconstrained” category had 40% exposure to investments rated below investment grade (or that didn’t have ratings). This compares with less than 7% for the average intermediate-term bond fund. What’s more, there isn’t any such exposure in the Barclays U.S. Aggregate Bond Index.
[Jeff] It is difficult to judge risk/reward when the risks are difficult to determine!
Market Timing
You are likely to pick the wrong time to invest as well as the wrong stocks! (Morgan Housel). One stock has earned a quarter trillion dollars in profit since 2012 without much change in price. Another has earned nothing while the stock has tripled. He has several other great examples.
But disagreeing with popular sentiment is easier said than done. Few things feel better than fitting in, and having a viewpoint that goes against everyone around you is a mental battle not one person in a ten can maintain for long. Rather than identifying extremes in current sentiment, it’s easier to justify the market’s mood no matter what it is.
If your perspective is short-term, you need to figure out what everyone else thinks now as well as what they will think tomorrow.
Even value investors can be tricked by chasing the best returns from the prior year. (Morningstar).
Final Thoughts
Our top sources – Brian Gilmartin and FactSet are always mandatory reading, but especially so during earnings season. FactSet shows the relative exposure to dollar strength. In Q1, the effect was still strong. Whether it will continue is a key question.
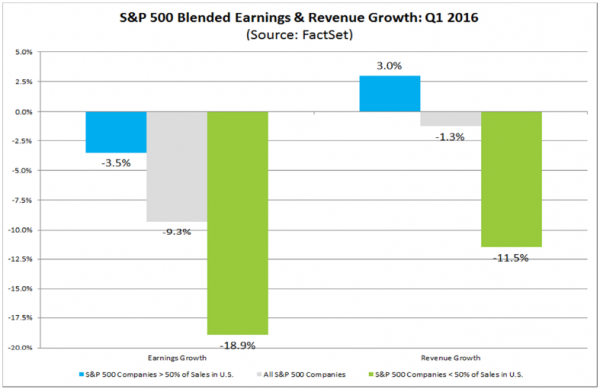
Brian Gilmartin notes the importance of the Doha conference and also maintains his position that this this quarter will mark the earnings bottom.
My Take
For traders, it is difficult to figure out either the trend or the contrarian position. Markets have moved higher for little apparent reason and many are positioned for selling. Bloomberg quotes traders as questioning whether oil could possibly move higher after the meeting.
I expect the options “hangover” but no lasting effect. We are prepared to do some buying into a soft Monday market.
For investors, I see many value stocks still trading at recession prices. For an investment portfolio you should embrace the opportunity to do some buying. We have recently trimmed stocks that hit price targets, so we are shoppers on weakness.
For our Enhanced Yield program (selling short-term calls against dividend stocks) we see many positions that will work in a flat market.
Don’t be stubborn. Take what the market is giving you!

