It is (ahem) a very big week for new data. The A-teams are back from their mini-vacations, ready to take a fresh look at the new world. While some will continue to work the Trump Administration/stock theme, it remains mostly guesswork. There is a new theme, which markets and pundits will get around to, perhaps as soon as this week. With a tone change on the economy and deficits, I expect the punditry to be asking:
Can the market embrace some good news?
Last Week
Once again, last week’s light calendar of economic news was nearly all good, but not the focus of discussion.
Theme Recap
In my last WTWA, I predicted special attention to the Trump stimulus plan and how it might be financed. Must of the week’s discussion was about possible cabinet appointments and the policy implications, but spending and taxation got plenty of attention. It was a s good a guess as any.
The Story in One Chart
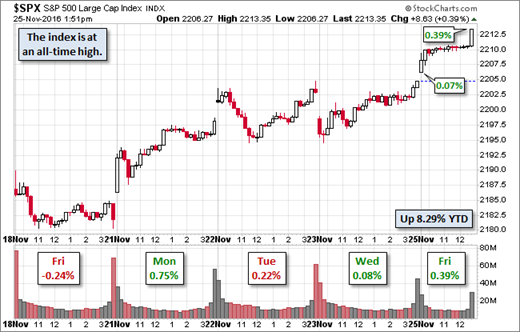
I always start my personal review of the week by looking at this great chart of the S&P 500 from Doug Short. He captures the continuing rally and the move to new highs.
Doug has a special knack for pulling together all the relevant information. His charts save more than a thousand words! Read his entire post where he adds analysis grounded in data and several more charts providing long-term perspective.
Personal Note
I am taking a few days off, so there will be no WTWA next week.
The News
Each week I break down events into good and bad. Often there is an “ugly” and on rare occasion something very positive. My working definition of “good” has two components. The news must be market friendly and better than expectations. I avoid using my personal preferences in evaluating news – and you should, too!
This week’s news was quite good. If I missed something for the “bad” list, please feel free to suggest it in the comments.
The Good
- Rail traffic is improving reports Steven Hansen at GEI. The story is even better if you remove coal and grain.
- Technical indicators are strong. Our own technical models remain strongly bullish. Noted technician John Murphy (via Charles Kirk) has this comment:
“There is little doubt that the market’s trend is still higher. The fact that it’s being led higher by economically-sensitive stock groups like energy, materials, industrials, small caps, and transports is a sign of strength. The fact that tech stocks are starting to strengthen is also a positive sign.”
- Chemical activity shows continuing strength. Calculated Risk monitors this indicator, which seems to lead industrial production.
- Durable goods rebounded nicely to an increase of 4.8%.
- Existing home sales were strong at 5.6M SAAR, beating expectations. Calculated Risk cautiously notes that the results do not reflect the recent higher mortgage rates.
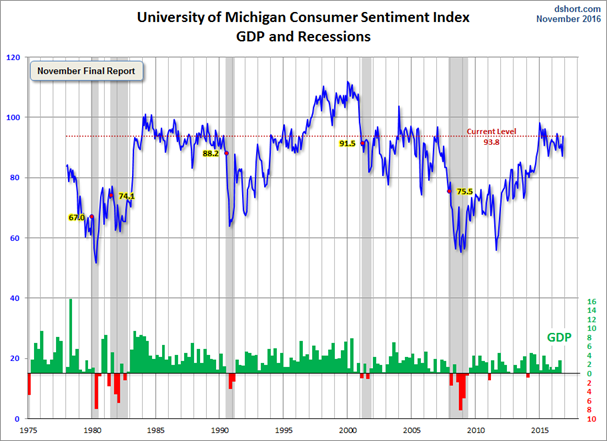
- Michigan sentiment beat expectations moving to 93.8. Doug Short has a comprehensive review.
The Bad
- New home sales fell on an annualized basis. The decline included both multi and single-family residences. Calculated Risk offers perspective. Please compare the measured response here and above on existing home sales.
- Mortgage rates moved above 4%. (MarketWatch).
- Trucking is still declining, but the rate seems lower. Steven Hansen at GEI reviews the mixed picture.
The Ugly Beautiful
At some point, I need to do an update on last week’s “Fake News” ugly award. There is a good cyberspace discussion, but that can wait.
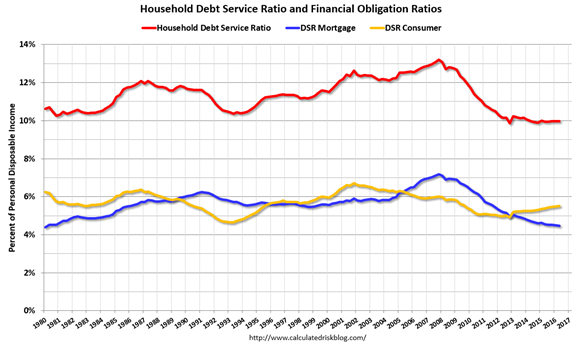
As I occasionally do, I want to focus on the positive for a change. Bill McBride of Calculated Risk had an encouraging Thanksgiving post, Five Economic Reasons to be Thankful. Read the whole post, but here is one that might surprise you – household debt levels.
The Silver Bullet
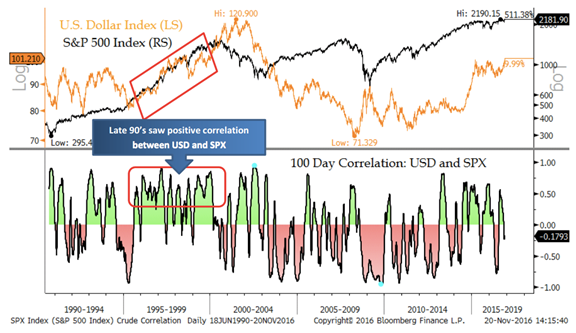
I occasionally give the Silver Bullet award to someone who takes up an unpopular or thankless cause, doing the real work to demonstrate the facts. This week’s award goes to Jon Krinsky of MKM Partners, with a big assist from Josh Brown. There is a consensus that countries are racing to debase currencies in “beggar thy neighbor” policies. The stronger dollar certainly reduces earnings for some companies, especially if they do not do any currency hedging. The flip-side gets no attention. Josh writes, There is zero evidence of a long-term correlation between stocks and the dollar. Take a look.
The Week Ahead
We would all like to know the direction of the market in advance. Good luck with that! Second best is planning what to look for and how to react. That is the purpose of considering possible themes for the week ahead. You can make your own predictions in the comments.
The Calendar
We have the data avalanche that we often see when the first two days of the new month are at the end of the week. This quirk of the calendar makes this the biggest week of the year for data.
The “A” List
- Employment report (F). Expectations are a little lower for the data markets see as most important.
- Consumer confidence (T). A good concurrent read on spending and employment.
- ISM index (Th). Still modest growth in this widely-followed measure?
- Auto sales (Th). Important sector, private data, and not a survey. What more could you want?
- ADP private employment (W). Deserves more respect as an alternative to the “official” data.
- Personal income and spending (W). Important economic growth indicator. Will strength continue?
- Beige book (W). Provides descriptive color for FOMC participants, and occasionally some policy insight.
- Initial claims (Th). The best concurrent indicator for employment trends.
The “B” List
- Construction spending (Th). Rebound expected in this important sector.
- GDP second estimate (T). Somewhat “old news” but still the base for the ultimate measure of economic growth.
- Chicago PMI (W). Most important of the regional surveys, with some predictive power for ISM.
- Pending home sales (W). Less direct impact than new construction, but a good read on the housing market.
- Crude inventories (W). Recently showing even more impact on oil prices. Rightly or wrongly, that spills over to stocks.
For those who missed it during the holiday-shortened week, Fedspeak is back! We could also get big news out of the oil production talks between OPEC and non-OPEC members.
Next Week’s Theme
This will be a big week for news, and it might also be for stocks and bonds. For a long time, the market reaction has been entirely Fed-focused. If the economy looked better, the Fed would start raising rates. If it looked worse, the Fed was expected to help. Whatever the reason, the tone has now changed. Economic data have been better, and there is more optimism. There is growing acceptance of higher interest rates. The market seems untroubled (so far) by the rate move and the strength in the dollar.
While few remarked on the tone change last week, I expect it to get more attention in the week ahead, especially if economic data remains strong. It will leave us wondering – Can the market finally celebrate good news?
This is a multi-part theme prediction. We do not know that the data strength will continue. We do not know what the FedSpeak comments will be. And finally, we do not know how markets will react. We have a clue about how the political world will react (via Charles Kirk).
“I’m getting a real kick out of how so many Republicans have gone from bear to bull on US economy overnight and how many Democrats have done the opposite.”- Patrick Chovanec
This change will be reflected in comments from the punditry this week.
As usual, I’ll have a few ideas of my own in today’s “Final Thoughts”.
Quant Corner
We follow some regular great sources and the best insights from each week.
Risk Analysis
Whether you are a trader or an investor, you need to understand risk. Think first about your risk. Only then should you consider possible rewards. I monitor many quantitative reports and highlight the best methods in this weekly update.
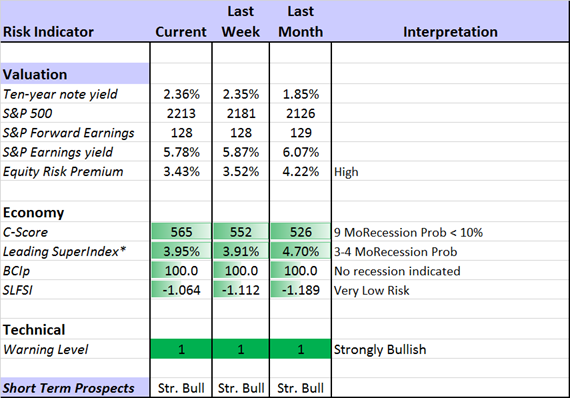
The Indicator Snapshot
The increased yield on the 10-Year note has lowered the risk premium a bit. I suspect much more to come. By this I mean that the relative attractiveness of stocks and bonds will continue to narrow.
The Featured Sources:
Bob Dieli: The “C Score” which is a weekly estimate of his Enhanced Aggregate Spread (the most accurate real-time recession forecasting method over the last few decades). His subscribers get Monthly reports including both an economic overview of the economy and employment.
Holmes: Our cautious and clever watchdog, who sniffs out opportunity like a great detective, but emphasizes guarding assets.
Brian Gilmartin: Analysis of expected earnings for the overall market as well as coverage of many individual companies.
RecessionAlert: Many strong quantitative indicators for both economic and market analysis. While we feature his recession analysis, Dwaine also has several interesting approaches to asset allocation. Try out his new public Twitter Feed. His most recent research update suggests some “mixed signals” from labor markets.
Doug Short: The World Markets Weekend Update (and much more).
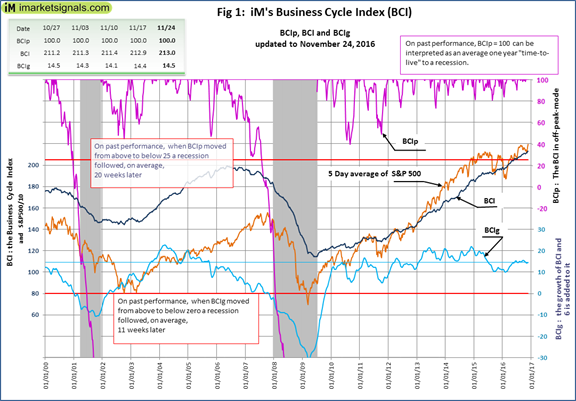
Georg Vrba: The Business Cycle Indicator, (latest edition below) and much more. Check out his site for an array of interesting methods. Georg regularly analyzes Bob Dieli’s enhanced aggregate spread, considering when it might first give a recession signal. Georg thinks it is still a year away. It is interesting to watch this approach along with our weekly monitoring of the C-Score.
Urban Camel at The Fat Pitch analyzes recession forecasts based upon the Presidential Cycle, a popular current theme. This is a great article. (A Silver Bullet candidate at least). Here is a key quote:
More to the point, there are better ways to forecast the next recession than counting months on a calendar or focusing on changes in the presidency. How?
By monitoring changes in the macro data. A persistent slow down in retail sales, housing consumption, employment growth and other macro indicators will likely be a better method for indicating when a recession is becoming more likely. This is the stuff that matters most; the calendar and presidential terms are demonstrably inadequate on their own. Our regular commentary on the macro environment can be found here.
This is very good advice to the recession worrywarts.
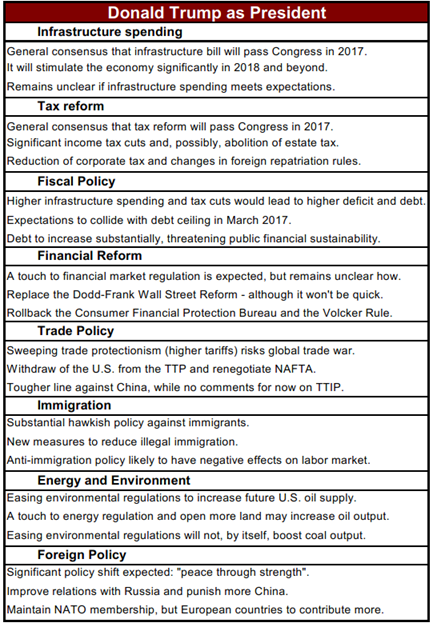
If (like me) you are a quant who is always hungry for more data, you will love FocusEconomics. You get a compendium of information from around the world, with cogent analysis. To take one example, here is their update on the Trump effects:
There are so many interesting topics that it is difficult to describe in one example.
How to Use WTWA (especially important for new readers)
In this series, I share my preparation for the coming week. I write each post as if I were speaking directly to one of my clients. Most readers can just “listen in.” If you are unhappy with your current investment approach, we will be happy to talk with you. I start with a specific assessment of your personal situation. There is no rush. Each client is different, so I have six different programs ranging from very conservative bond ladders to very aggressive trading programs. A key question:
Are you preserving wealth, or like most of us, do you need to create more wealth?
My objective is to help all readers, so I provide several free resources. Just write to info at newarc dot com. We will send whatever you request. We never share your email address with others, and send only what you seek. (Like you, we hate spam!) Free reports include the following:
- Understanding Risk – what we all should know.
- Income investing – better yield than the standard dividend portfolio, and less risk.
- Holmes and friends – the top artificial intelligence techniques in action.
- Why it is a great time to own for Value Stocks – finding cheap stocks based on long-term earnings.
You can also check out my website for Tips for Individual Investors, and a discussion of the biggest market fears. (I welcome questions on this subject. What scares you now?)
Best Advice for the Week Ahead
The right move often depends on your time horizon. Are you a trader or an investor?
Insight for Traders
We consider both our models and the top sources we follow.
Felix and Holmes
We continue with a strongly bullish market forecast. Felix is fully invested. Oscar is fully invested in aggressive sectors. The more cautious Holmes also remains fully invested, but with continued profit-taking and position switching. The group did not meet on Thanksgiving Day, but you can expect reports to resume in this Thursday’s “Stock Exchange.” Out of the many Holmes picks this week, I can report one that seemed to capture a theme, Fomento Economico Mexicano SAB, (NYSE:FMX). This Mexican holding company, trading via the ADR, includes several retail holdings. (Think Coke and Heineken). Holmes likes to play rebounds on a technical basis, so this is an interesting play on Trump policy from a source who knows nothing about the election or the news. (We report exits from announced Holmes positions if you ask to be on that list. Write to holmes at newarc dot com).
Top Trading Advice
Brett Steenbarger keeps on bringing it, day after day. His posts are a must-read for traders, but often have broader scope. If you are trying to perform well at anything, Dr. Brett can help you. My favorite piece this week was about a movie featuring young drummers. It is often helpful to go outside of your own world, take an objective perspective, and then look for the lessons.
Adam H. Grimes has a good explanation of how to calculate volatility in Excel. I find that most people consistently over-estimate volatility, perhaps goaded by the CNBC reports of “triple digit moves” and a 50-point bounce since the lows. These are both basically meaningless unless you are trading a very large short-term position.
Bill Luby discusses common misperceptions about the VIX. This is a great example of those who need to use Adam Grimes’ spreadsheet!
You can always tell when the crowd gets long the VIX and ends up on the wrong side of the trade. “The VIX is broken!” becomes an oft-repeated refrain, as does “The markets are rigged!” and the usual list of exhortations from those who are in denial. The current line of thinking is that the world must be much more dangerous, risky and uncertain as a result of a Trump victory, yet the VIX is actually down 31.4% since the election – ipso facto the VIX is broken.
The VIX is a market measure, not something readily rigged. If you disagree, you are simply on the wrong side of the market.
Insight for Investors
Investors have a longer time horizon. The best moves frequently involve taking advantage of trading volatility!
Best of the Week
If I had to pick a single most important source for investors to read this week it would be Michael Batnick’s post, This is Not Bearish. The question is the new all-time highs in stocks. I know from experience that the average investor sees this as some sort of warning. Instead of interpreting prices in context, they see a chart or a range and expect mean reversion.
Michael looks at data since 1928. How many new market highs do you suppose have been made since then? How many this year? The answers are 1134 and 11. I suspect that few would come close in their guesses. 18% of all months have closed at all-time highs. Here is what happens after a new high:
The time after a new high is nothing special – and nothing to worry about.
This post was frequently cited, but I enjoyed the color provided by Brian Gilmartin. His story about how a Chicago TV producer uses psychological tests to find the most stressful stories is priceless!
Stock Ideas
Brian Gilmartin has a mixed take on health care (seems right to me). Policy is changing. Defensive stocks are in question. More aggressive picks might do well. Check out his objective, earnings-based take for some ideas.
Tiernan Ray (Barron’s) has a helpful article on deal stocks. While value investors always look for cheap stocks, these are also often good takeover targets. It is helpful to keep an eye on the candidates.
Mexico a screaming buy? MarketWatch analyzes the trade rhetoric and prospects. (And note Holmes above).
Freeport McMoran (NYSE:FCX)? Stone Fox Capital analyzes the relationship between copper prices and the stock price. Not much of a boost is needed, and the copper market has been strong.
Personal Finance
Professional investors and traders have been making Abnormal Returns a daily stop for over ten years. If you are a serious investor managing your own account, you should join us in adding this to your daily reading. Every investor should make time for a weekly trip on Wednesday. Tadas always has first-rate links for investors in his weekly special edition. There are always several great choices worth reading. My personal favorite this week is Jonathan Clements’ piece on the two financial numbers you need to know. Hint: You might have a clue about this, but are probably measuring incorrectly.
Seeking Alpha Editor Gil Weinreich’s Financial Advisors’ Daily Digest is a must-read for financial professionals. The topics are frequently important for active individual investors. I especially liked this post on dividends. Why do so many insist on regular cash payments? Gil nails it with his answer – the security of regular payments.
If you are wondering whether you might do better with a financial advisor, check out my latest paper, The Top Twelve Investor Pitfalls – and How to Avoid Them. If you regularly navigate these problems, you can fly solo. Readers of WTWA can get a free copy by sending an email to info at newarc dot com. We will not share your address with anyone.
Market Outlook
Eddy Elfenbein provides several interesting facts about the economy, helping us all to keep perspective. You will enjoy the mixture of surprises and items you might guess. Did you know that nearly half of mutual fund managers do not own their own fund?
Eddy’s ETF (CWS), based upon his successful annual list, is getting a lot of deserved attention. It is off to a good start.
Bill Kort reviews the most recent predictions of the end of the world.
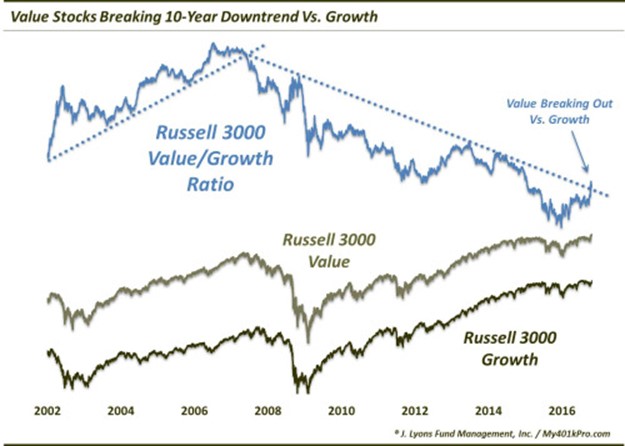
Value Investing
The rebound of the value approach continues. Dana Lyons provides the most recent evidence.
Watch out for…
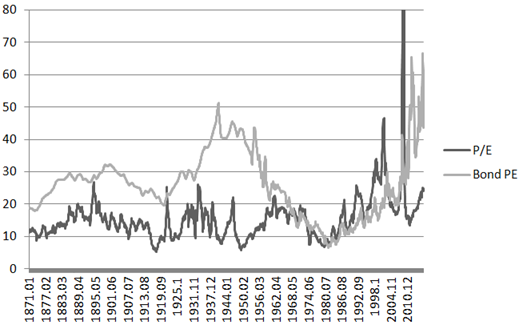
The bond market. The Brooklyn Investor compares bonds and stocks over a long period. The analysis reveals the shortcoming in measures like the Shiller P/E, which consider neither interest rates nor inflation. There are many helpful charts, but here are some examples.
I am always baffled at comments like, “The market has averaged a P/E ratio of 14x for the last 100 years so the stock market is 40% overvalued at 20x…”.
How can you compare 14x P/E to the current level without discussing interest rates? And if you think stocks should trade at 14x P/E today, then you should also think that interest rates should be much higher than they are now. For example, the 10-year bond rate averaged 4.6% since 1871 and 5.8% since 1950. But these periods include a time when interest rates were not set by the market.
And also this:
1955-2014:
Interest rate range average P/E
4 – 6% 23.3x
6 – 8% 19.6x
I looked at the data from 1955-2014 (adding one more year to update this isn’t going to change much) to see what the average P/E ratios were when interest rates were in certain ranges.
From the above, we see that the market traded at an average P/E of 23.3x when interest rates were between 4% and 6%. The 10-year now is at 2.3%. So we have a long, long way to go for interest rates to threaten the stock market, at least in terms of the bond-yield/earnings-yield model.
Final Thoughts
If you want to analyze a change, you need to know when it starts. Here is part of an example from my causal modeling classes.
When does change start?
- When the new Captain orders a change in course?
- When the crew knows the new Captain will order a change?
- When the crew knows the new Captain, but not whether he will order a change?
- When the crew knows there will be new Captain who might order a change?
- When the crew knows there might be a new Captain?
I am sure you get the idea. The methods that track the market under various Presidents have many problems, but the starting and ending points are especially important. There are no new Trump policies. We are all still guessing about what they might be.
And yet – there has been a definite change in tone. Economic strength has a lot to do with confidence – the willingness to invest and to spend. A divided government had many dysfunctional consequences, especially repeated issues about the debt limit and spending on crucial programs. We can expect less of that. There will also be a very different reaction to economic data; the political rhetoric that blinded investors will be reduced.
The generalized Fed theory will have less traction. Those who have been wrong about the market for years have used the Fed as a fig leaf. With interest rates rising and the economy improving, that story must change.
The emphasis on commodity prices as an economic indicator, most prominently by the ECRI, is also proving wrong, as is the impact of a stronger dollar.
This is not an endorsement of specific Trump policies. It is the reality of moving out of the election environment – at least for a year or so! This week’s data avalanche could be the first real test of this new attitude.

