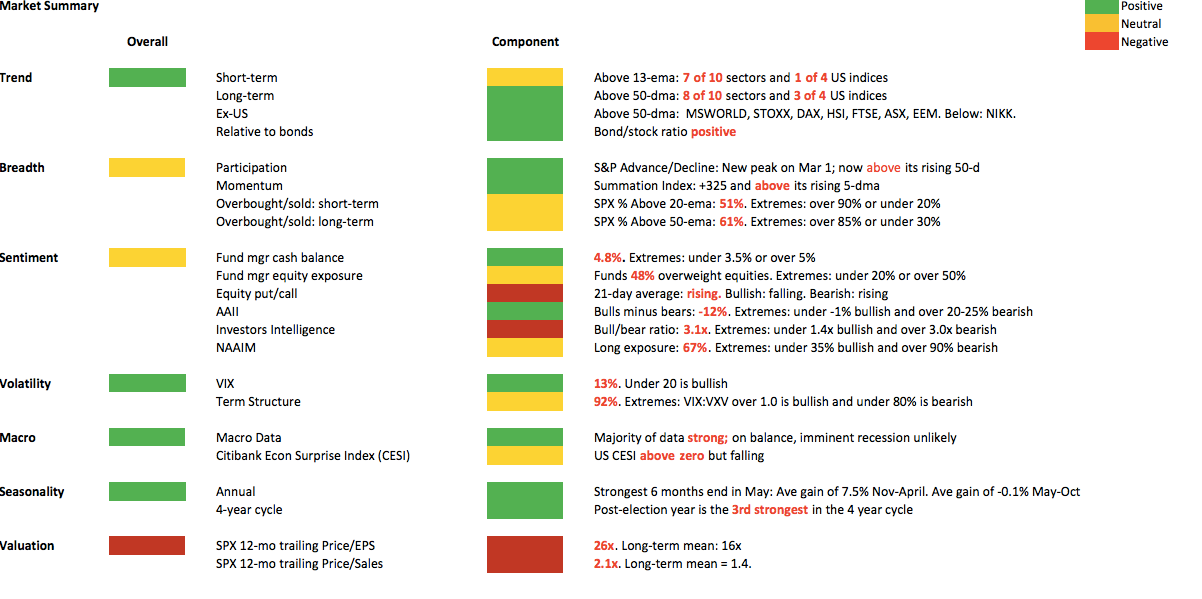
Summary: US indices made their all-time high in early March; aside from the NASDAQ, which made new highs this past week, these indices have since moved sideways. SPX has alternated up and down 5 weeks in a row, producing little net gain. Seasonality is particularly strong in April, so a fuller retest of the March highs might still be ahead this month. And indications that 2017 will be a good year for equities continue to add up.
But there is a notable set up in place for the first correction since November to trigger. This week is likely to be pivotal.
Our last weekly summary post two weeks ago emphasized two points. First, that strong uptrends weaken before they strongly reverse. Second, that even years with powerful returns (think 2013's 30% gain) experience multiple drawdowns of 3-8% along the way, meaning the smooth uptrend that had been in place from November to March has likely ended. That post is here.
In the event, SPX reversed and gained 2% at its highest point in the following week. That high was less than 1% from the index's all-time high (ATH). The broader NYSE was similar. Both NDX and COMPQ made new ATHs this past week.
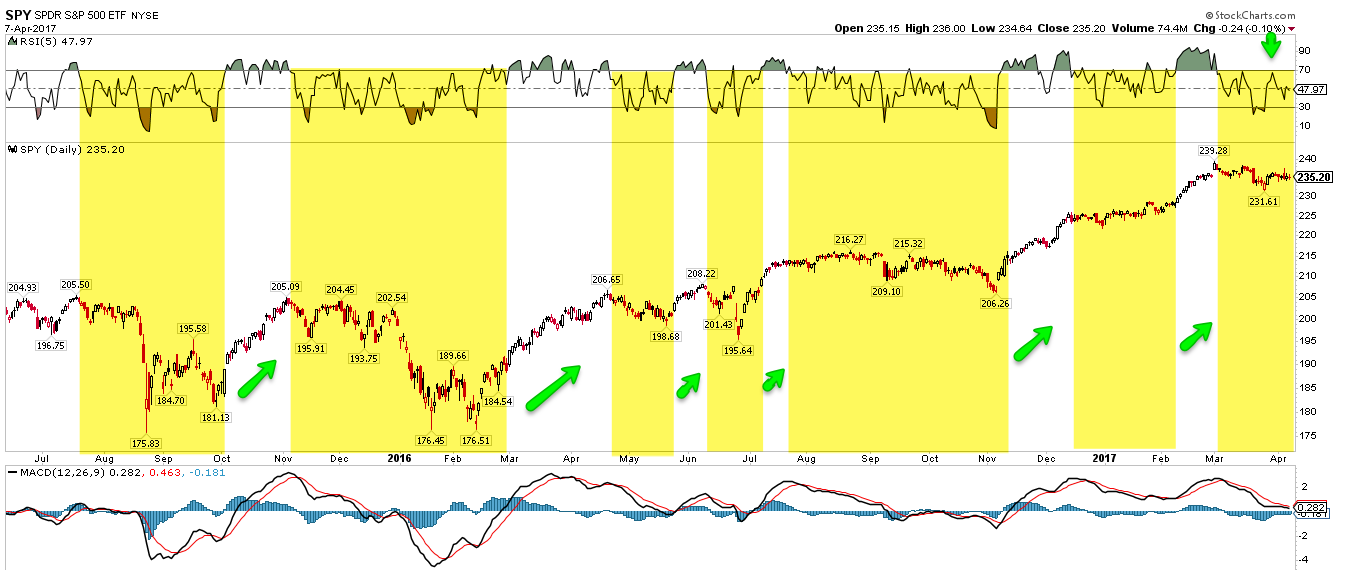
Still, it's accurate to say the reversal in equities has been weak so far. Uptrends (green arrows) are partially defined by their ability to become and then stay overbought (top panel). Since the State of the Union on March 1, SPX has failed in this regard. Short term moving averages are either declining or flat. Until this changes, SPX is likely to chop sideways or, more likely, test lower levels (yellow shading). Enlarge any chart by clicking on it.
The upcoming week is likely to provide some resolution. SPDR S&P 500 (NYSE:SPY) has alternated direction (up, down) the past 5 weeks, with little net gain. That loss of momentum typically leads lower. In the weekly chart below, note that the MACD histogram is now at zero (lower panel). When it has gone negative (vertical lines), SPX has subsequently fallen to its 20-wma or lower Bollinger® (arrows). This implies a move to 2300 to 2200, respectively, equal to a loss of another 3% to 7%.
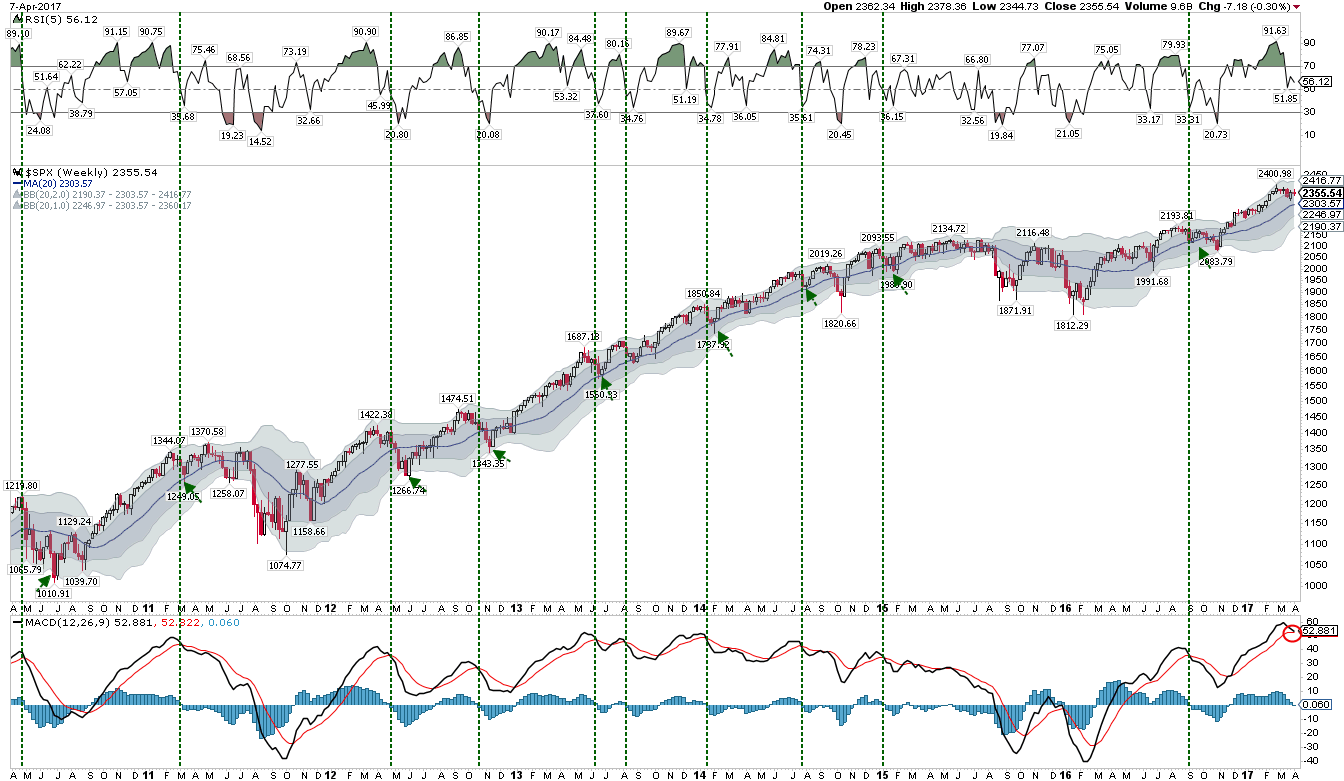
In the chart above, note that those downtrends are typically close to ending when weekly momentum is oversold (top panel).
The set-up two weeks ago was for a bounce off the first touch of the 50-dma (blue line). Check. But subsequent touches increase the probability of a break lower. SPX is now back at that 50-dma. Below the 50-dma and a move to the 2300 area is likely; that area corresponds to the December and January resistance high (orange shading). That is likely to be good initial support for a reaction higher. Multiple touches there, however, make a subsequent move to the 200-dma (red line) likely. That 2200 level was the resistance high from August to November. The first touch of the 200-dma is also very likely to lead to a strong rebound (green arrows).

So, this upcoming week appears to be pivotal. The weekly set-up (which hasn't triggered yet) is at a point where further weakness ushers in the first corrective move since November.
Corrections can happen any time but they are less likely in April than in just about any other month. April is seasonally one of the most bullish months of the year for equities. This is a tailwind for SPX that argues for a more clear retest of the March 1 high being directly ahead.
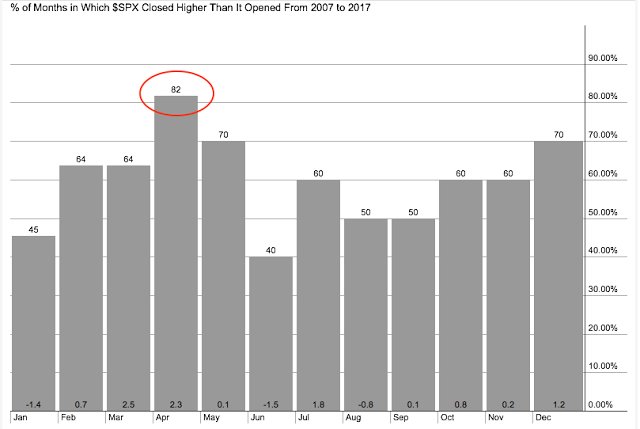
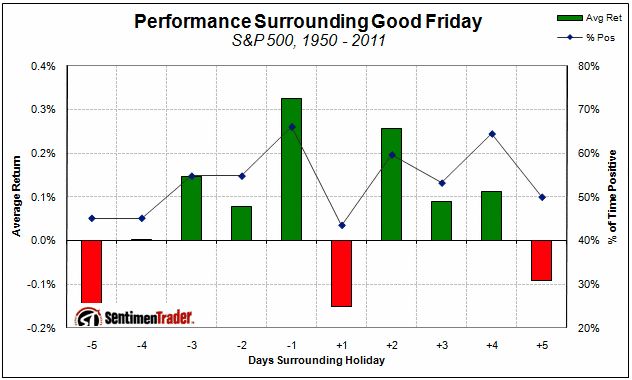
Add to this that the upcoming weekend is Good Friday: SPX is typically strong the 3 days before and after this holiday. The week after Good Friday is April OpX, another seasonally strong week. Seasonality has not been particularly accurate over the past few months, but these are potential short term tailwinds (from Sentimentrader).
Sentiment data is mixed: there's no clear headwind or tailwind, at least short term. Bulls outnumber bears by more than 3:1 as measured by Investors Intelligence. That's usually a headwind. On the other hand, almost $12b flowed out of equity mutual funds and ETFs in the past week, one of the largest outflows of this bull market. That suggests investors are quite anxious: a tailwind. Many sentiment surveys became overall bullish in early December and equities have moved significantly higher. In that respect, the last 5 weeks could be seen as a healthy digestion of those gains.
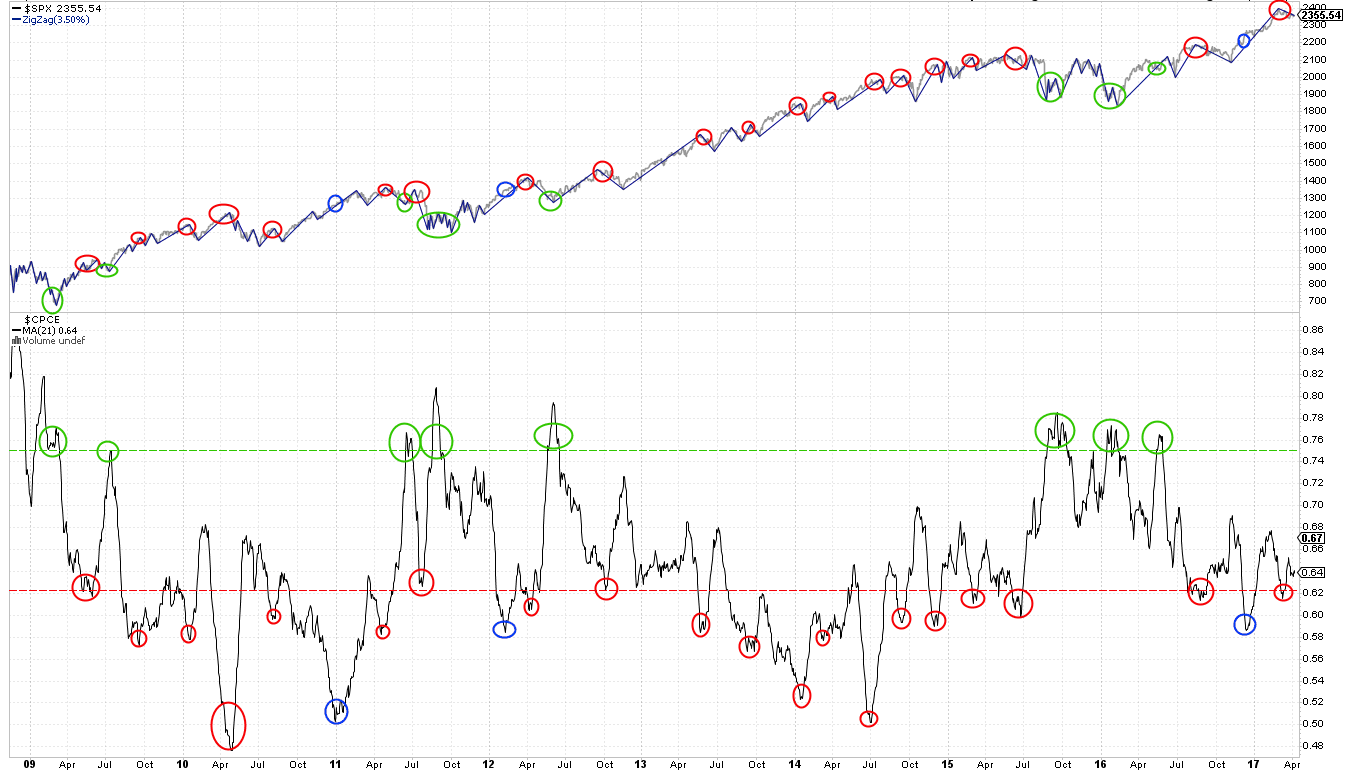
On balance, we suspect that short-term sentiment supports further downside, even if it is limited. The 21-day equity-only put/call ratio has remained near a bullish extreme for most of 2017. These extremes have been very reliable indicators of a minimum drawdown in SPX of 3.5% (red circles). A bullish extreme was reached in mid-December, yet SPX moved higher (blue circle). That has happened only two other times since 2009: in January of 2011 and 2012. In both cases, SPX moved lower within a few months: SPX lost 5% in March 2011 and 10% in April-May 2012. The 2200-2300 levels mentioned earlier correspond to a high-low drawdown of 8% and 5%, respectively.
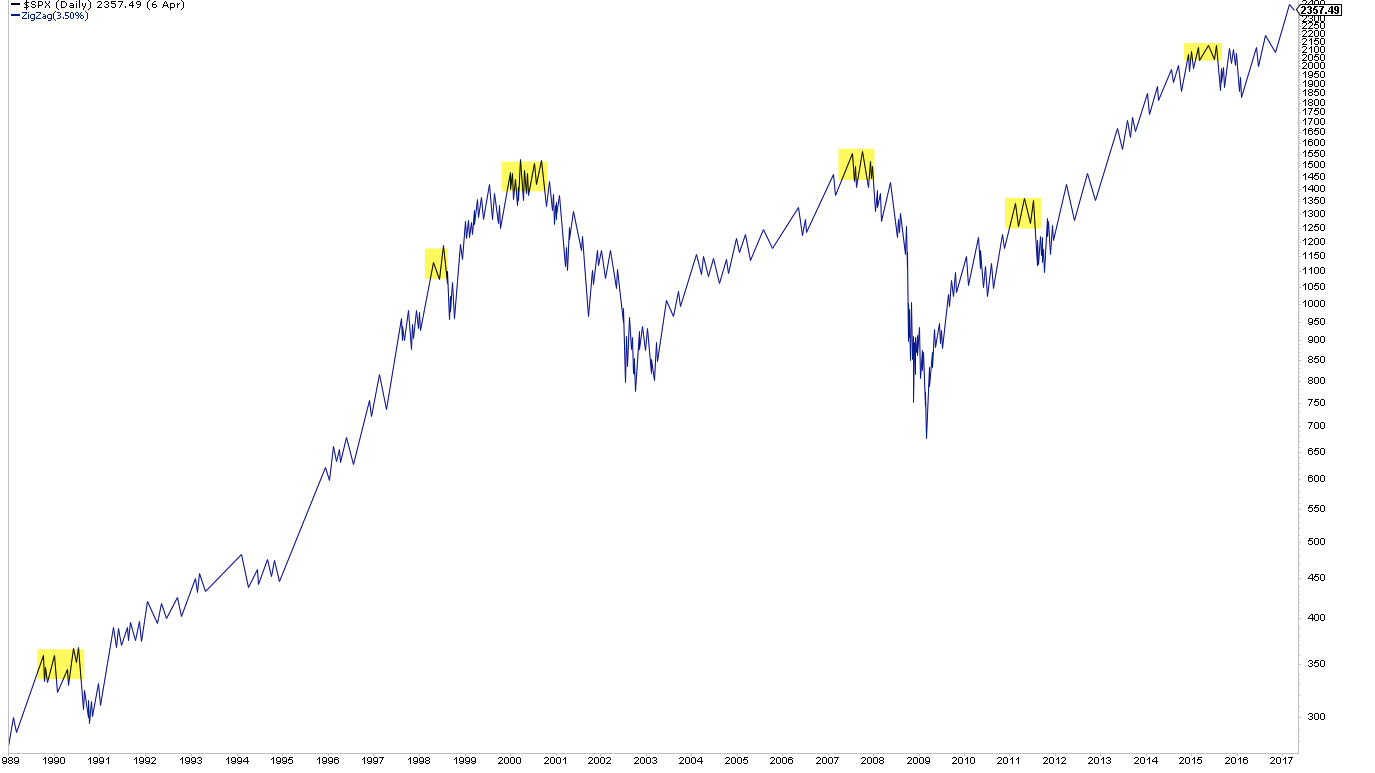
Again, negative reactions like these are a normal part of every uptrend, even those as steady as 2013. Right now, there is little reason to suspect a more bearish top has completed. Significant tops are preceded by multiple drops and recoveries of more than 3% before they finally finish, creating a sawtooth pattern (shading). Volatility rises during this time. None of this has yet taken place.
There are, in fact, a number of compelling studies suggesting that 2017 will continue to be a good year for US equities. A post on this is here.
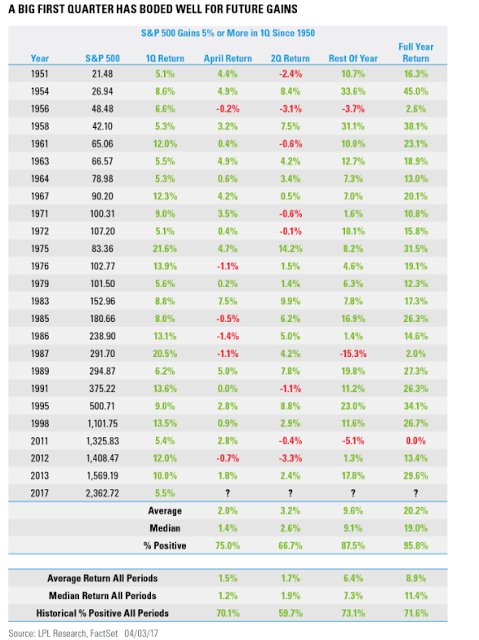
We can add to this list two more studies. First, when SPX gains more than 5% in the first quarter (as it did this year), the next three quarters have added to those gains 88% of the time by a median of 9%. There is never a perfect set-up but the odds here are very strongly bullish (from Ryan Derrick).
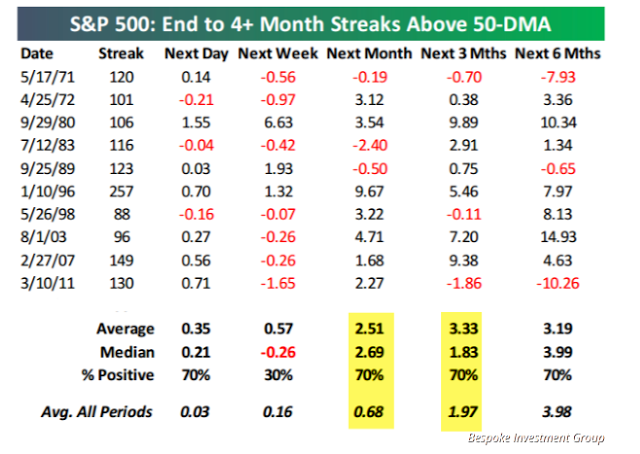
Second, SPX has now closed over its 50-dma more than 4 months in a row, one of the longest streaks in the past 50 years. SPX has been higher 1, 3 and 6 months later 7 out of 10 times, with additional median gains of 2-4%. Again, strong but not perfect odds that favor additional upside in 2017 (from Bespoke).
Economic data continues to be good. An imminent recession is unlikely. More on this in our monthly macro update here.
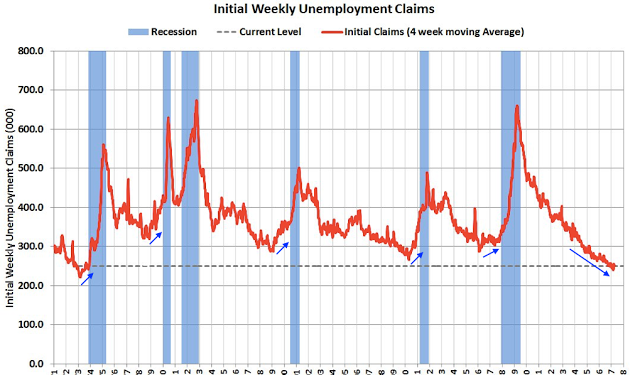
Employment data continues to be mostly positive: new jobs are being added and wages are rising. This is a net positive for consumption which forms the backbone for economic growth. Unemployment claims continue to fall to 50 year lows. In the past, claims have started to rise at least one year ahead of a recession, so the current expansion is likely to continue into 2018 (arrows; from Calculated Risk).
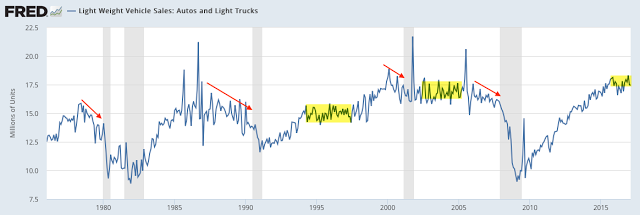
Auto sales have become an investor concern and it's true that auto sales have weakened. The annual sales rate fell to 16.5m units in March, a two year low. But auto sales can be choppy for extended periods during an expansion (shading); there is normally a pronounced fall in sales more than a year ahead of a recession (arrows). It is too early to say that auto sales alone are signaling an imminent recession, but the data clearly bears monitoring closely in the months ahead. According to BAML, if auto sales remain at 16.5m for the remainder of 2017, GDP growth would be reduced by just 10 basis points.
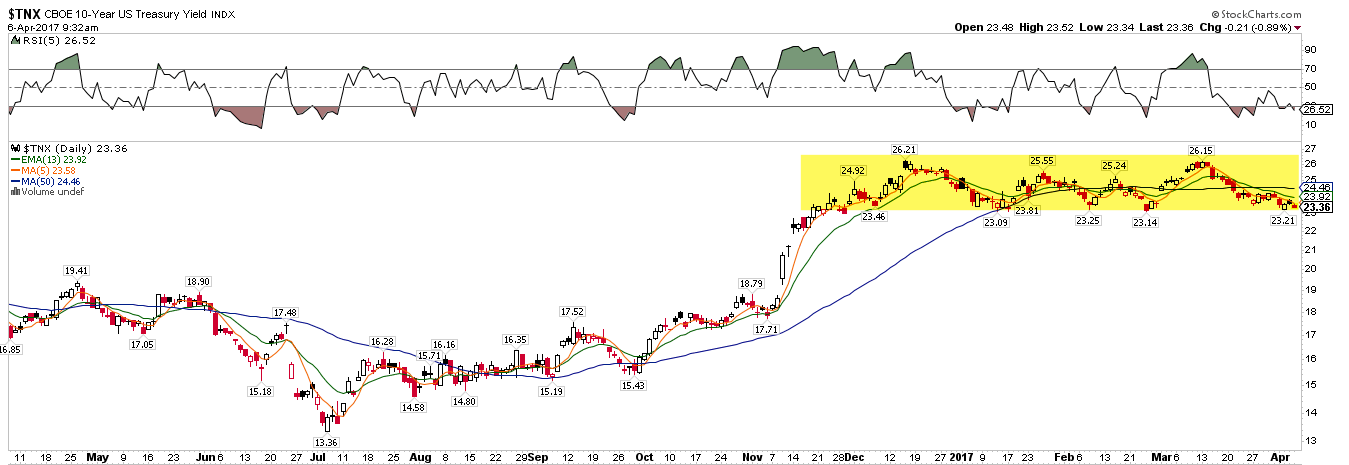
Lastly, despite the FOMC raising the Federal Funds rate for a third time in March, Treasury yields have moved lower the past several weeks. This also happened in the weeks following the December hike as well as the hike in December 2015. This pattern was discussed before the latest rate hike here.
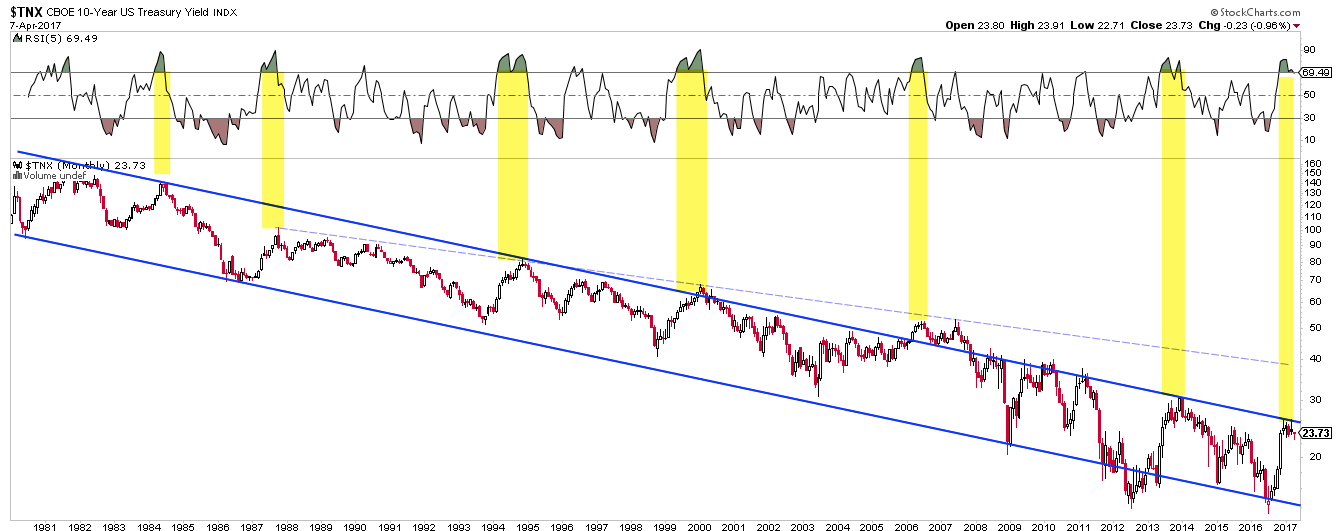
Ten-year Treasury yields are now at 5 month lows. Yields have returned to this level now for a 4th time since December. Further weakness argues for a retracement of the ramp-up in yields following the election in November. Bond prices (like iShares 20+ Year Treasury Bond (NASDAQ:TLT)) move opposite to yields, so these would move higher.
Current 10-year yields are at the top of a channel that has existed since yields peaked in 1981, so what yields do in the next several weeks is highly significant.
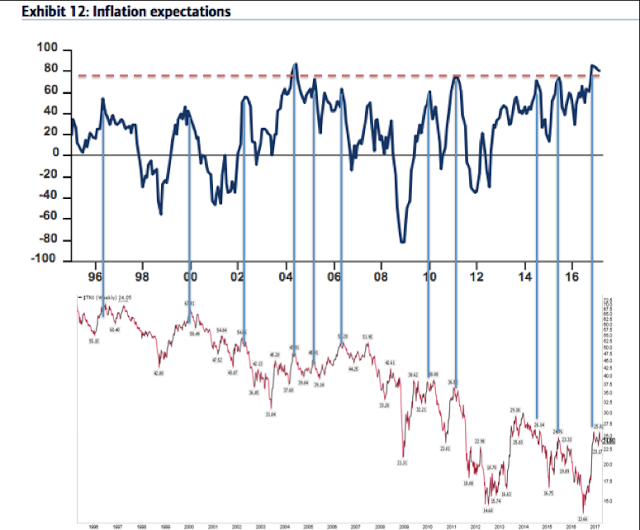
Fund managers are positioned for bond yields to move higher, not lower, as their inflation expectations are at 13-year highs (top panel). That usually has not worked out (yields are in the lower panel). A recent post on this is here.
In summary, US indices made their all-time high in early March; aside from the NASDAQ, which made new highs this past week, these indices have since moved sideways. SPX has alternated up and down 5 weeks in a row, producing little net gain.
Seasonality is particularly strong in April, so a fuller retest of the March highs might still be ahead this month. And indications that 2017 will be a good year for equities continue to add up. But there is a notable set-up in place for the first correction since November to trigger. This week is likely to be pivotal.
On the calendar this week: US equity markets are closed on Good Friday but retail sales and CPI will be released that day.
