- SPX gains for third straight month, but each month momentum slows
- Dollar climbs even as yields rise; Gold set to top out
- Oil posts highest close since November
Stocks climbed for a third straight month, closing out the first quarter of 2019 with strong gains. The equity rebound was fueled by the Federal Reserve's pivot on rate hikes, better than expected earnings results and optimism that a U.S.-China trade deal will finally be reached. Yields climbed on Friday as well, for a second day. Sounds promising for Q2, right?
However, gains each month have been lower than the month previous. And yields remain inverted, demonstrating that bulls are not out of the woods just yet. Overall, we're still bearish.
Best Quarter for S&P 500 Since Q2 2009
The S&P 500 climbed 0.67% on Friday, led by Healthcare (+1.2%) and Industrials (+1.08%) shares. Energy (-0.15%) and Real Estate (-0.3%) were the only two sectors in the red. On a weekly basis, the benchmark also finished 1.2% higher. Industrials (+2.85%) and Materials (+2.15%) led the pack while defensive Utilities (-0.55%) and growth-oriented Communication Services (-0.43%) were the only sectors in the red.
The SPX added 1.79% for the month; Technology (4.43%) and Real Estate (4.35%) pushed higher, while Financials (-3.05%) and Industrials (-1.72%) sank lower. For the quarter, the S&P surged 14.03%. All sectors were deep in the green, with a minimum 7.62% boost for Healthcare and a whopping 20.52% surge for Technology.
It was the best quarter for the S&P 500 Index since Q2 2009, which also established the bottom for the 2008 crash.
Nonetheless, a deeper drill down shows that SPX momentum may be running out. In January, the benchmark jumped 7.87%, the most since October 2015. January’s stellar performance was followed by a more tempered February, when the index added only 2.97%, the biggest jump since August (excluding January, of course), the best performance in seven months. However, the gauge edged up just 1.79% during March, mediocre by earlier 2019 standards.
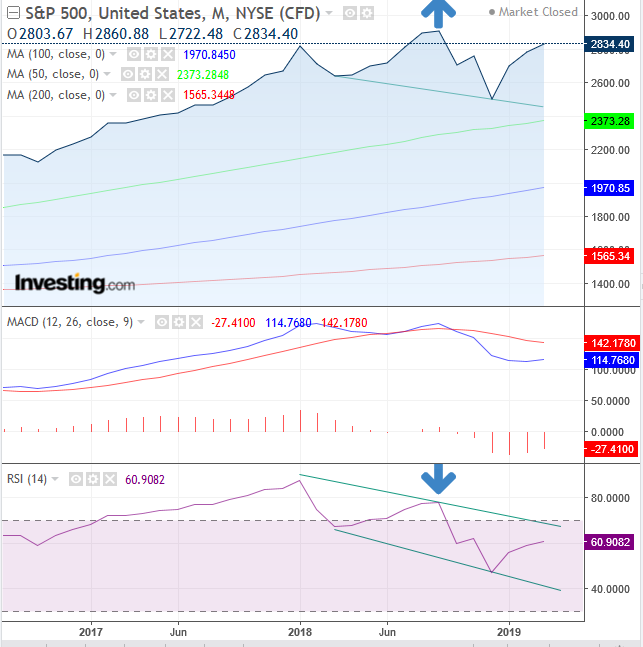
Technically, the 50 DMA stopped right below the 200 DMA, a potential catalyst one way or another. The SPX posted its highest close since the selloffs that followed the September peak.
From a glass-half-empty perspective, however, the price failed to even test the previous week’s intraday high, which formed a bearish shooting star. Finally, a monthly view reveals that the price may have formed an imperfect (due to a small upper shadow) hanging man at the very resistance of the January 2018 highs, setting up a massive down-sloping H&S top-scenario, with both MACD and RSI supporting that view, the latter of which also provide a negative divergence (arrows).
Note that while the longer the view the more reliable the analysis, so is the required level patience, as there could be considerable noise till the move's conclusion.
Yields on the 10-year Treasury ended higher Friday, for the second day, with the daily MACD heading for a bottom, with the RSI having already bottomed, bouncing from the 26 levels, the lowest since the December rout, climbing toward 32, completing a double bottom. However, yields closed well off their highs. On the weekly chart, yields closed well off their lows, after finding support at the 200 WMA.
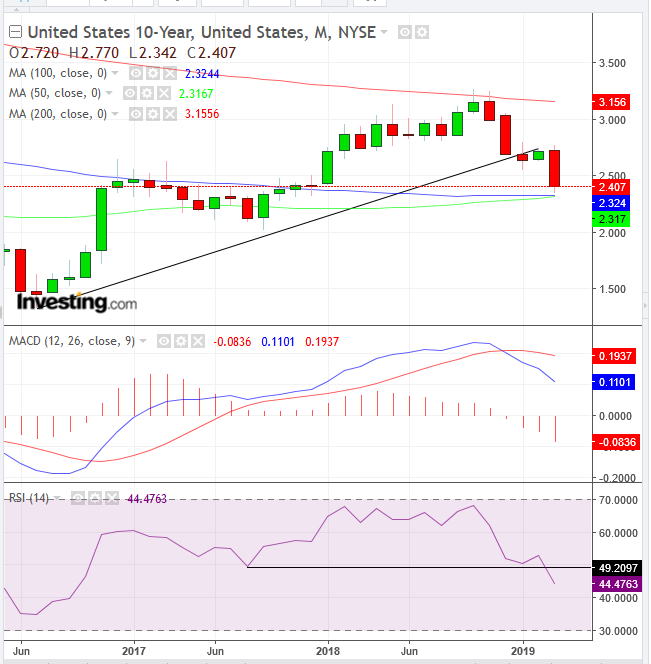
Finally, in a monthly view, we are reminded that yields fell below their uptrend line since the mid-2016 bottom, after finding resistance at the 200 MDA. For now, the 50 and 100 MDA provide support, while the monthly MACD and RSI signal further declines in the long-term (though the daily and especially weekly charts allow for an upward correction).
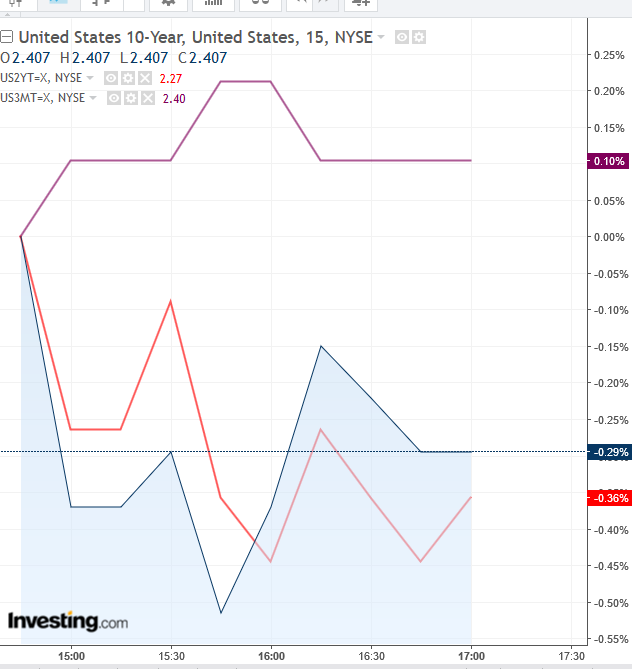
Even with the Thursday-Friday rebound, 10-year yields remained below 3-month yields, for the first time since 2017, when it signaled the ensuing 2008 crash and Great Recession, the worst in 70 years.
Nevertheless, Federal Reserve Bank of Minneapolis President Neel Kashkari is not convinced the yield inversion is necessarily signaling an upcoming recession. Rather he believes it's investors communicating to the Fed that the central bank may have set its policy too tightly. Kashkari does cover all his bases though, allowing that a recession next year is “certainly possible.” Still, he believes the U.S economy will continue to expand.
However, White House chief economic adviser Larry Kudlow called on the Fed to “immediately” cut interest rates by a half percentage point, escalating the Trump administration’s fight with the central bank and challenging its independence. The ruckus may have escalated after Trump’s pick for the Fed board, Stephen Moore, said the same.
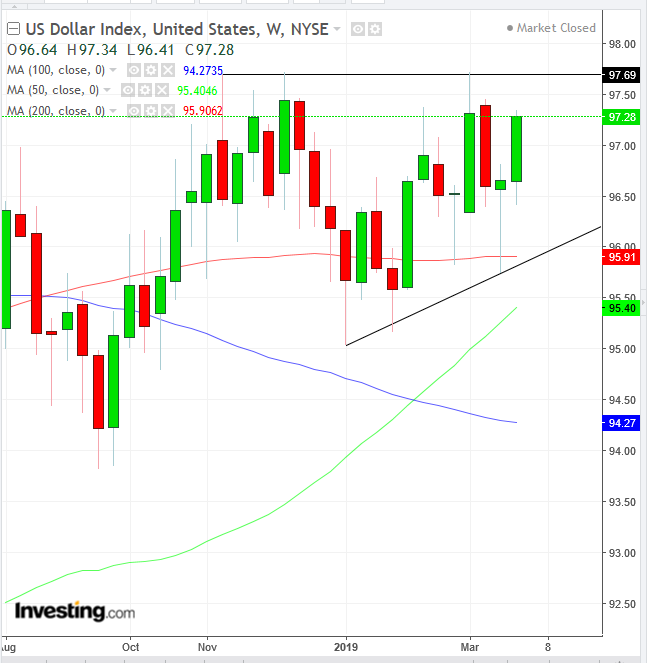
The dollar, meanwhile, moved higher for the fourth straight day, hitting its highest level since March 8, even as demand for Treasurys ebbed over the last two days. Technically, the greenback is forming an ascending channel, whose bullish outlook would be complete with an upside breakout.
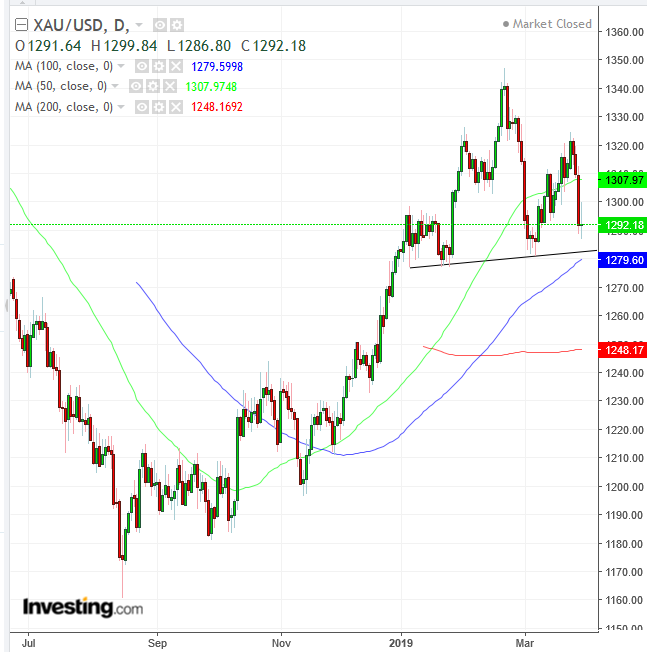
Gold, on the other hand, is set to complete an H&S top reversal.
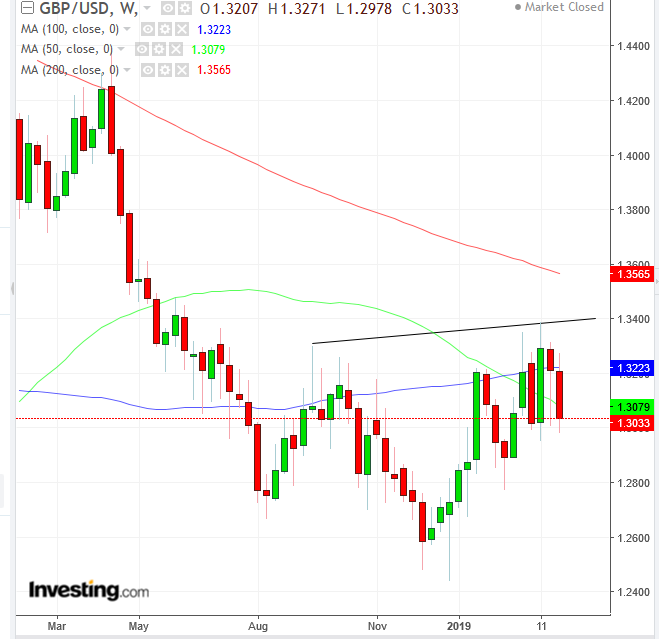
As the U.K. edged closer to a general election after Parliament rejected Theresa May’s Brexit deal for a third time on Friday, the pound retreated. Technically, sterling’s second weekly slide avoided completing a massive H&S bottom. Cable has been ranging since August.
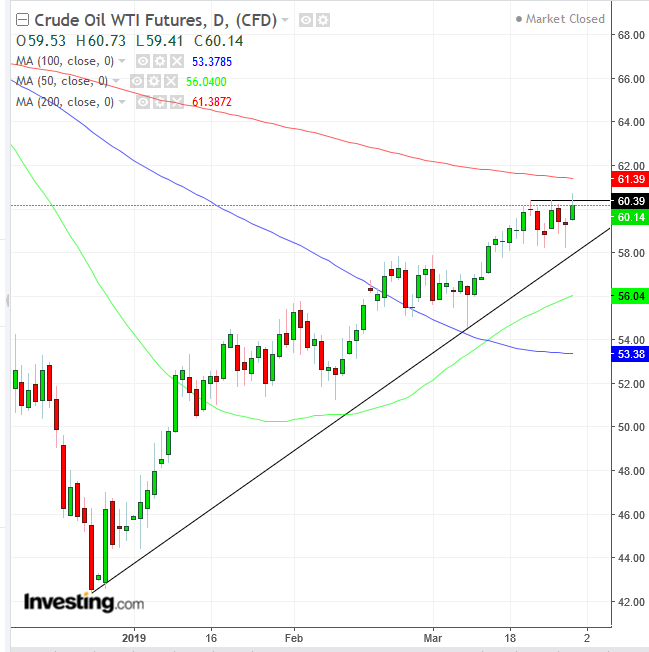
Commodities were up significantly, driven by a 30% surge in oil prices, which reached their highest level since November, following OPEC's production cuts. Technically, the price has been unable to scale above the Mar. 21 high of $60.39, as the rally paused below the 200 DMA, along the price congestion from mid-2016 to mid-2017. A cross above the $61.50 level would signal the trend’s resumption, taking on the mid-70s highs of 2018.
Week Ahead
All times listed are EDT
Sunday
21:30: Australia – NAB Business Confidence (March): index forecast to rise to 4 from 2.
21:45: China – Caixin Manufacturing PMI (March): forecast to hold at 50.1 from 49.9.
Monday
4:30: U.K. – Manufacturing PMI (March): index expected to fall to 51.2 from 52
5:00: Eurozone – CPI (March, flash): prices to remain flat at 1.5% YoY, and core CPI to rise edge lower to 0.9% from 1.00.
5:00: Eurozone – Unemployment Rate (February): jobless rate to hold at 7.8%.
8:30: U.S. – Retail Sales (February): sales expected to rise 0.3% from 0.2% MoM.
10:00: U.S. – ISM Manufacturing PMI (March): activity expected to stay flat at 54.2
23:30: Australia – RBA Rate Decision: no change in policy expected.
Tuesday
4:30: U.K. – Construction PMI (March): expected to climb to 49.8 from 49.5.
8:30: U.S. – Durable Goods Orders (February): orders expected to fall to -1.1% MoM from 0.3%.
21:45: China – Caixin Services PMI (March): index expected to rise to 52.3 from 51.1.
Wednesday
5:00: Eurozone – Retail Sales (February): sales expected to fall to 0.2% from 1.3% MOM and fall to 2.0% from 2.0% YoY.
5:30: U.K. – Services PMI (March): index expected to weaken to 51 from 51.3.
8:15: U.S. – ADP Employment Report (March): 184K jobs expected to have been created, edging up from 183K last month.
10:00: U.S. – ISM Non-Manufacturing PMI (March): index to fall to 58.0 from 59.7.
10:30: U.S. – EIA Crude Inventories (w/e 29 March): stockpiles expected to fall by 2.7 million barrels.
Thursday
10:00: Canada – Ivey PMI (March): expected to rise to 51.4 from 50.6.
Friday
8:30: U.S. – Nonfarm Payrolls (March): payrolls expected to rise by 175K, from 20K last month; the Unemployment Rate is expected to hold at 3.8% and Average Hourly Earnings forecast to rise 0.2%, down from an upward revision of 0.4% MoM.
