REVIEW
The market started the week at SPX 2006. On Monday the market gapped up at the open, traded back down to SPX 2006 then closed where it opened at 2021. Tuesday and Wednesday displayed gap up openings as well, as the market traded up to SPX 2065. Thursday’s half day trading was quiet, but the rally hit SPX 2067 before ending the week at 2061. For the week the SPX/DOW gained 2.65%, the NDX/NAZ gained 2.50%, and the DJ world index gained 2.30%. Economic reports for the week were positive. On the uptick: the FHFA, PCE, personal income/spending, consumer sentiment, plus weekly jobless claims improved. On the downtick: Q3 GDP, existing/new home sales, and Q4 GDPn. Next week is of course is the New Year, markets will be closed Friday, and reports will be highlighted by the Chicago PMI and Case-Shiller.
LONG TERM: bull market
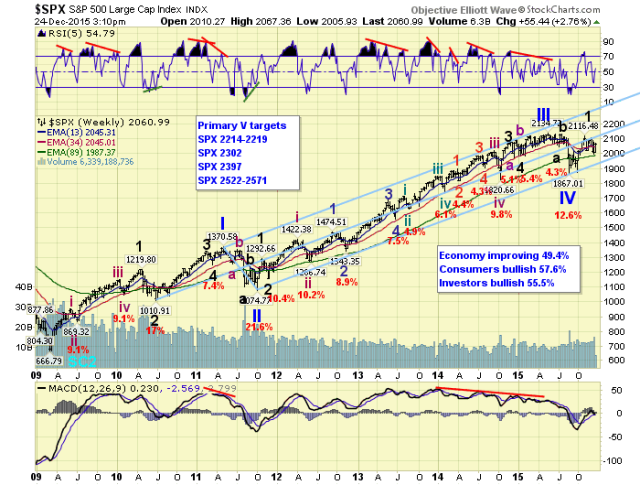
The 6+year, five primary wave, Cycle wave [1], bull market continues. Primary waves I and II completed in 2011, and Primary waves III and IV completed in 2015. Primary wave V is currently underway. When it ends a Cycle wave [2] bear market will follow and the market will probably lose 45% to 50% of its value.

When one reviews the weekly chart, it is easy to spot the 2011 and 2015 fractals. 2011 started the year at 1257.64 and ended the year at 1257.60. In May of that year, the market hit its high at SPX 1372. It then sold off into August/October for Primary II, ending the year with Major waves 1 and 2 completed for Primary III.
2015 started the year at 2057.94; will it end the year at 2057.90? In May of this year the market hit its high at SPX 2135. It then sold off into August for Primary IV, retested in October, and ended the year with Major waves 1 and possibly 2 completed for Primary V. Both Primary wave years look to finish about flat after 2-3 years of good gains.
MEDIUM TERM: uptrend may be underway
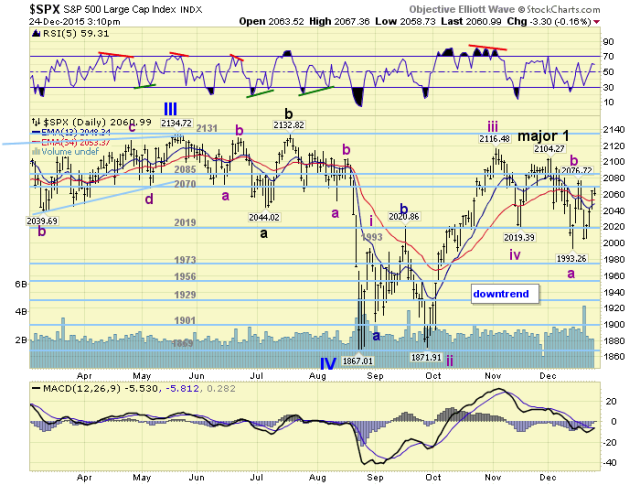
After the Primary IV low back in August, the Int. wave i rally to SPX 1993, and the odd near full retracement in October, the market took off to the upside into early-November for Int. iii. Then after an Int. iv pullback to SPX 2019 in mid-November, the market again started acting odd. Int. wave v did not make new highs, like it should have, and Major wave 1 ended at SPX 2104.

After that there was a quick, but complex decline to SPX 1993, which we thought could have ended Major wave 2. The market then rallied to SPX 2077, pulled back to 2005, and now has rallied to 2067. We accepted the fifth wave failure at SPX 2104 with the confirmed Major 2 downtrend. Now we may be forced again to accept a failed C wave should the market confirm an uptrend. This is quite odd behavior for this bull market.
As you can see by the labeling on the chart above, the SPX 1993 low was labeled Int. a of Major wave 2. The rally to SPX 2077 as Int. b, and the decline that followed should have made a lower low for Int. c. It stopped at SPX 2005 for a potential failed Int. c, if a Major wave 3 uptrend is confirmed soon. If not we would expect SPX 1993 to be retested, or even the 1973 pivot to be hit, to complete Major 2. Currently caught in the middle until one or the other event occurs. Medium term support is at the 2019 and 1973 pivots, with resistance at the 2070 and 2085 pivots.
SHORT TERM
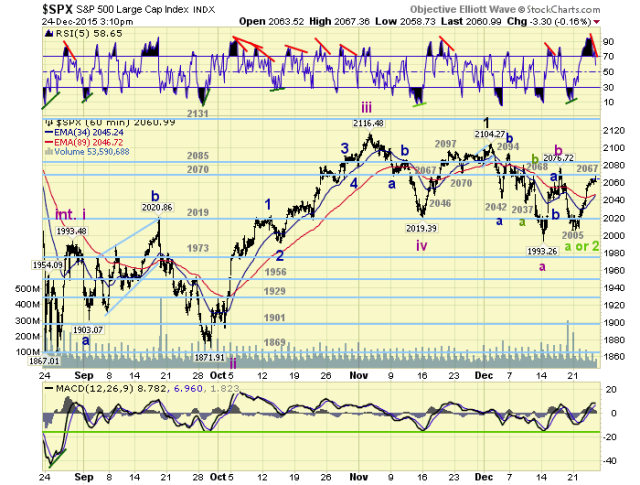
Despite the above noted dilemma, there is a positive pattern unfolding shot term. On Monday there was a rally to SPX 2023, then a decline to 2006. After that the market rallied in five waves for the rest of the week: 2017-2008-2030-2020-2067. These five waves may be the beginning of a Major wave 3 uptrend. With Friday/Monday’s SPX 2005/2006 a failed Int. wave c to complete Major wave 2 may have occurred. Tricky and complex, but possible. Should the market clear the 2085 pivot, this is probably the correct count.

Short term support is at SPX 2042 and the 2019 pivot, with resistance at the 2070 and 2085 pivots. Short term momentum ended the week with a negative divergence at Friday’s SPX 2067 high.