REVIEW
And a wild week it was! The market started the week at SPX 2012 after dropping down to SPX 1993 on Monday. The market rallied, with two gap up openings, to 2077 on Wednesday right after the FED increased rates 25 bps for the first time in 9.5 years. Thursday, however, the market headed right back down again. And with Friday’s gap down opening it traded as low at SPX 2005. For the week the SPX/DOW lost 0.55%, the NDX/NAZ lost 0.35%, and the DJ World gained 0.1%. On the economic front this week’s reports came in mixed. On the uptick: building permits, housing starts, leading indicators, the WLEI, plus weekly jobless claims improved. On the downtick: the NY/Philly FED, industrial production, capacity utilization, and the NAHB as manufacturing continues to lag. Next week’s reports will be highlighted by Q3 GDP, Personal income/spending, and more Housing reports.
LONG TERM: bull market
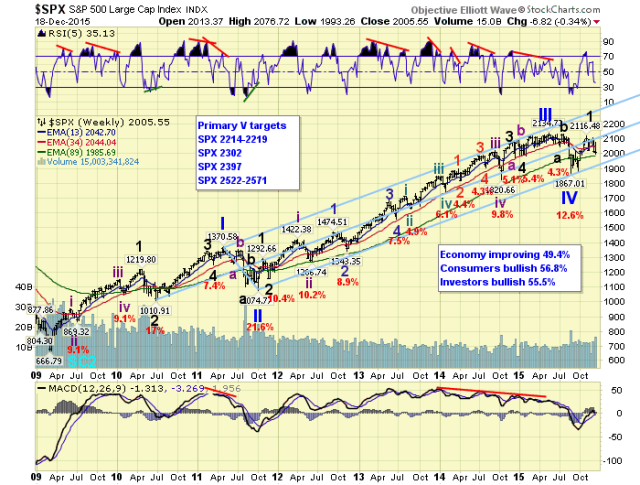
After completing four Primary waves from the March 2009 low, the market launched the first uptrend of Primary V. Since it did not make new highs, we are expecting Primary V to divide into at least five Major waves. Primary waves I and II completed in 2011, and Primary waves III and IV completed in 2015.

After the uptrend topped at SPX 2104 in early-December, the market entered a downtrend. We have labeled the uptrend Major wave 1, and the downtrend Major wave 2. When the next uptrend, Major wave 3, gets underway the market should be making new all time highs.
MEDIUM TERM: downtrend resumes
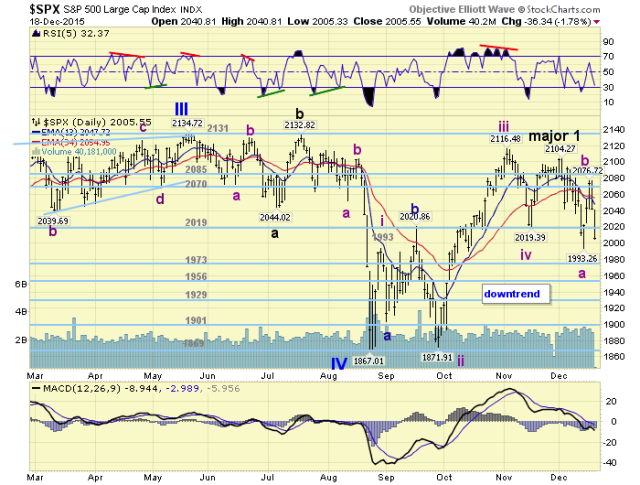
The uptrend from the Primary IV SPX 1867 low unfolded in quite an unusual pattern. First there was an Intermediate wave one to SPX 1993, then an irregular Intermediate wave two zigzag to 1872 (1903-2021-1872). This was followed by a very strong Intermediate wave three rally to SPX 2116. Then another oddity occurred. After an Intermediate wave four pullback to SPX 2019, Intermediate wave five failed to make a higher high (a fifth wave failure). The NDX/NAZ, btw, do not display this fifth wave failure. After the failure a new downtrend was underway.
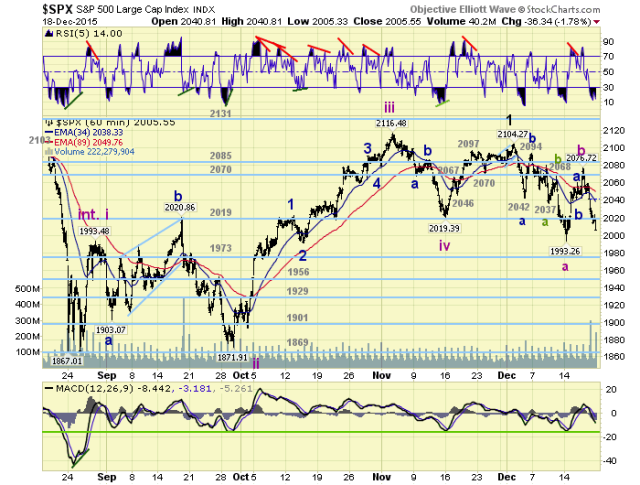
The downtrend started off, ( see hourly chart), from the SPX 2104 high, with a quick selloff to 2042. Then a just as quick rally to SPX 2092 followed. We had labeled these two waves Intermediate waves A and B of the Major wave 2 downtrend. With simple Int. waves A and B we knew a complex Int. wave C would follow, and it did. During this decline there was a corrective structure to SPX 2038, a three wave rally to SPX 2068, then another corrective structure to SPX 1993 on Monday. At this point we thought the downtrend ended at SPX 1993, as it hit the first of our three Major 2 support levels: SPX 1992/93, the 1973 pivot and the 1956 pivot.
The rally that followed, into Wednesday, was quite quick as the SPX hit 2077 right after the FED announced the rate increase. The structure of this advance looked fine, as there appeared to be five waves up to SPX 2060, and a pullback to SPX 2042. After that the market rallied in three waves (corrective) to 2077, and then started its Thursday/Friday decline. This kind of market activity looked quite similar to the start of the Major wave 1 uptrend, and even the start of Intermediate wave three. If this pattern had not appeared lately, we would have thought the downtrend was continuing.

Friday’s activity, however, suggests the Major wave 2 downtrend is not done. The count we were using looked fine up until Friday. Now it appears the SPX 1993 low was only Intermediate wave A, and the rally to SPX 2077 Int. B, with Int. C currently underway to end Major wave 2. The market could have held that irregular pattern. But now it appears it will/has not, as noted in the above daily chart. Medium term support is at the 1973 and 1956 pivots, with resistance at the 2019 and 2070 pivots.
SHORT TERM
With the updated count we now observe a complex Intermediate wave A to SPX 1993, followed by a simpler corrective rally to SPX 2077 for Intermediate wave B. A likely less complex Intermediate wave C is currently underway. From Wednesday’s SPX 2077 high we can count seven waves down into Friday’s SPX 2005 low: 2048-2059-2018-2028-2013-2024-2005.
Due to the complexity of Int. wave A, this Major 2 downtrend offers several possibilities. Int. C could complete at SPX 1992/1993 forming a flat. Int. C could equal Int. A which would create support at the low end of the OEW 1973 pivot range. And, Int. C could divide into a zigzag of its own which should find support in the upper end of the OEW 1956 pivot range. When Major wave 2 concludes a Major wave 3 uptrend, to new all time highs should begin.

It is interesting that last weekend we were looking at these three levels of support, and after all the gyrations this week we are right back here again. Short term support is at SPX 1992/93 and the 1973 pivot, with resistance at the 2019 pivot and SPX 2042. Short term momentum ended the week with a very slight positive divergence.
Which stock should you buy in your very next trade?
AI computing powers are changing the stock market. Investing.com's ProPicks AI includes 6 winning stock portfolios chosen by our advanced AI. In 2024 alone, ProPicks AI identified 2 stocks that surged over 150%, 4 additional stocks that leaped over 30%, and 3 more that climbed over 25%. Which stock will be the next to soar?
Unlock ProPicks AI