REVIEW
The market started the week at SPX 2079. After a gap up opening on Monday, the market rallied to SPX 2116, a new uptrend high, Tuesday afternoon. After that it pulled back for the rest of the week, hitting SPX 2084 on Friday, and closing at 2099. For the week, the SPX/DOW were +1.20%, the NDX/NAZ were +1.60%, and the DJ World index rose 0.10%. On the economic front, positive reports out numbered negative ones. On the uptick: construction spending, auto sales, ISM services, monthly payrolls, the MMIS, the GDPn, consumer credit, plus the unemployment rate and trade balance improved. On the downtick: ISM manufacturing, factory orders, the ADP, the WLEI and weekly jobless claims rose. After the close Friday, FED governor Brainard gave this speech: http://www.federalreserve.gov/newsevents/speech/brainard20151106a.htm. Next week’s reports will be highlighted by Retail sales, the PPI, and Export/Import prices.
LONG TERM: bull market
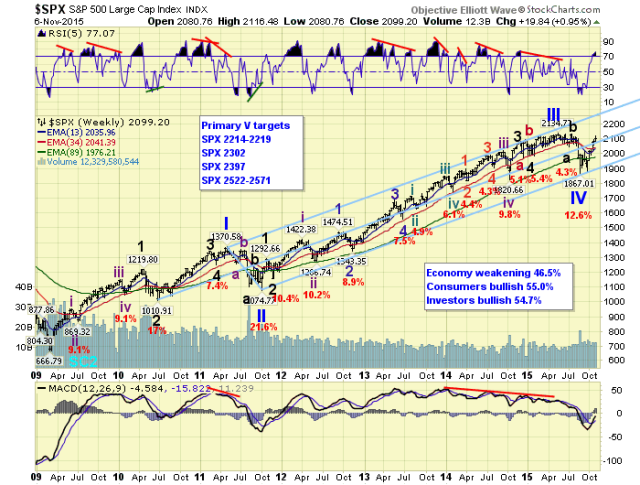
The 2009-2015 bull market continues to unfold as Cycle wave [1] with five Primary waves. Primary waves I and II completed in 2011, and Primary waves III and IV completed this year. Primary V is currently underway from the August SPX 1867 low.

When Primary V concludes, which could be this year, the Cycle wave [1] bull market will be over, and a Cycle wave [2] bear market will follow. The bear market should last about two years and the market should lose between 45% and 50% of its value. Our potential upside targets for the bull market high are posted on the weekly chart above. After six years of rising prices, it is time to prepare for a couple years of declining prices.
MEDIUM TERM: uptrend
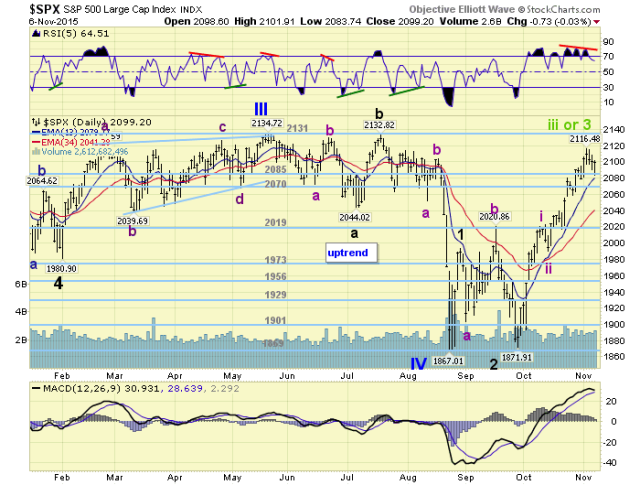
While the Primary IV correction was a bit tricky, due to all the volatility, we did get an uptrend confirmed just above the secondary low at SPX 1872. As a result, we posted the Primary IV low at SPX 1867, a Major wave 1 at 1993, and irregular zigzag Major 2 at 1872. After that, the market took off to the upside in a Major wave 3. This week, the SPX came within 19 points of its 2135 all time high. And, the NDX made a new all time closing high. Finally eclipsing its high of the year 2000. More confirmation that Primary V is unfolding.

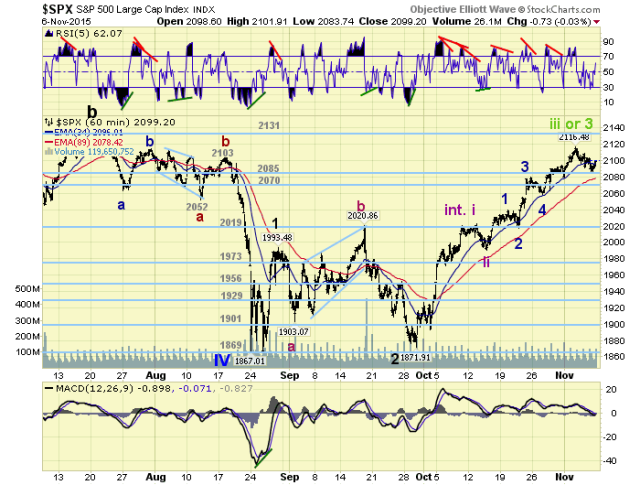
The recent five week rally from SPX 1872-2116 was quite easy to track until late this week. We had counted five waves up to SPX 2022 for Intermediate wave i, and an Int. ii pullback ending at 1991. Intermediate wave iii progressed right along with Minor waves 1-4 at SPX: 2039-2017-2080-2059. The market then rose to SPX 2085, pulled back to 2063 right after the FOMC meeting, then rose to 2094, dipped to 2079, then hit 2116 on Tuesday. Clearly the last five wave move, which should have been Minor 5 of Int. iii, was quite choppy. Nevertheless our Int. iii upside target of SPX 2120, from the 2090s, was nearly hit.
After the market pulled back to SPX 2090 on Thursday, we had to review the entire rally from SPX 1872 – 2116. This kind of choppiness late in a rally usually suggests there is another count at work. In the Thursday update, we posted two possibilities. Either Int. iii ended as expected or Major 3 had ended at SPX 2116. Medium term support is at the 2085 and 2070 pivots, with resistance at the 2131 and 2198 pivots.
SHORT TERM
As noted above, there are two possibilities for the recent SPX 2116 high: Int. iii or Major 3. If Intermediate wave iii topped, then the Thursday-Friday pullback: 2090-2104-2084 should be sufficient for Int. iv, and a rising Int. wave v should be underway. Our estimated support for Int. iv has been the 2085 pivot range.

Upon further review of the daily charts, we have noticed negative RSI divergences on all four major indices. This suggests the recent high could have indeed been Major wave 3. These divergences do not totally rule out one more higher high for Int. v. which would probably just extend the divergence further. But it does suggest that Friday’s SPX 2084 low is now a key support level, as is the 2085 pivot range.
Intermediate wave pullbacks during this entire uptrend have ranged between 31 and 42 points. Suggesting an Int. iv low between SPX 2074-2085, Since this range was hit on Friday with an abc decline, and an hourly RSI got oversold, Int. iv should have bottomed there. The only Major wave pullback during this uptrend was from SPX 1993-1872, or 121 points. While we are not expecting anything exactly that large for Major wave 4, since that occurred during a volatile period. A Major wave 4 pullback, from SPX 2116, probably would not find support until it hit the 2019 (pivot) – 2040 range: a 80 – 100 point pullback.
If SPX 2084 holds support, an Int. v rally to slightly higher highs is next. If not, then the Major wave 4 pullback continues into the SPX 2020-2040 range. Either way, a Major wave 4 pullback should occur soon. After that a rising Major wave 5 should take the market to all time new highs and probably conclude the bull market. Short term support is at the 2085 and 2070 pivots, with resistance at SPX 2120 and the 2131 pivot. Short term momentum hit oversold on Friday, then bounced to neutral.