REVIEW
The market started the week at SPX 2033. After some choppy activity on Monday, the market rose to SPX 2039 by Tuesday. Wednesday the market pulled back to SPX 2017. Then after two gap up openings, the market hit SPX 2080 on Friday. For the week, the SPX/DOW gained 2.3%, the NDX/NAZ gained 3.6%, and the DJ World index gained 1.2%. Economics reports for the week again came in mixed. On the uptick: housing starts, the NAHB, the FHFA and existing home sales. On the downtick: building permits, leading indicators, the WLEI, plus weekly jobless claims rose. Next week’s reports is highlighted by the FOMC meeting, Q3 GDP and the PCE.
LONG TERM: bull market
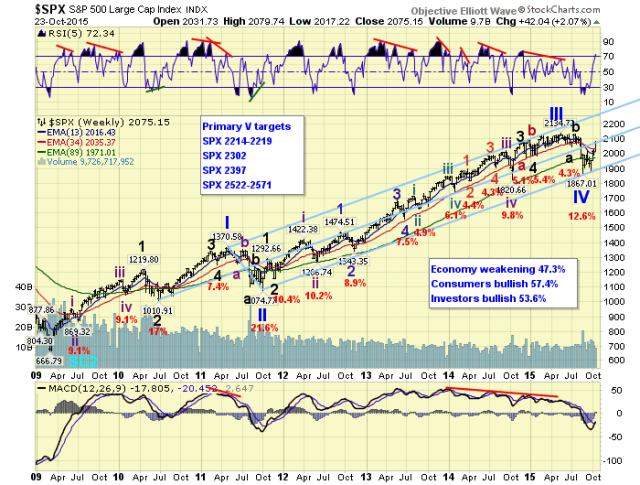
The 6+ year Cycle wave [1] bull market continues. Primary waves I and II, of this five primary wave bull market, completed in 2011. Primary waves III and IV recently completed in 2015. Primary wave V is currently underway.

During the past 30+ years, there have been six important fifth waves. Five of these fifth waves completed with just one uptrend. One failed to make new highs during its uptrend, and then subdivided into five waves before completing its high. When all six of these fifth waves completed the market had at least a 20% correction, (1990 and 1998), or entered a bear market, (1984, 1987, 2000, 2007).
Currently the market is uptrending from its SPX 1867 Primary IV low. Should this uptrend make new all time highs before it ends, the current high is SPX 2135, probabilities suggest the bull market will end when the uptrend ends. Cycle wave bear markets can be quite nasty. Markets can lose between 45% and 50% of their value in a short period of time. The previous two Cycle wave bear markets were 1937-1942 and 1973-1974. The first one witnessed a 50.2% market decline in just the first 12 months. The second, a 46.6% market decline in just 23 months. After 6+ years of rising prices, it is time to start preparing for the next bear market.
MEDIUM TERM: uptrend
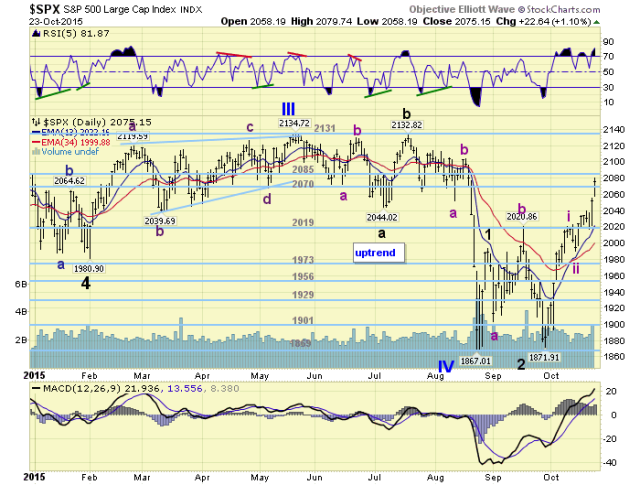
We have labeled the Primary IV low in August at SPX 1867. Primary wave V should consist of five Major waves. Major wave 1 was labeled at the SPX 1993 high in late August. Then the market experienced an odd irregular zigzag for Major wave 2. This zigzag, (1903-2021-1872), bottomed in late September. After that low the market started rising in Major wave 3.

Impulsing Major waves divide into five Intermediate waves. During Major 1 these waves were quite quick: 1915-1880-1990-1948-1993. Major wave 3, however, is acting normally. Thus far we have counted Intermediate wave i completing at SPX 2022. Then after an Int. ii pullback to SPX 1991, Int. wave iii began rising. When Int. iii does conclude, possibly around SPX 2120, we should see an Int. iv pullback and then an Int. v rally to complete Major wave 3. Then after a Major wave 4 pullback, which could be quite steep, a Major wave 5 rally should end the uptrend. Medium term support is at the 2070 and 2019 pivots, with resistance at the 2085 and 2131 pivots.
SHORT TERM
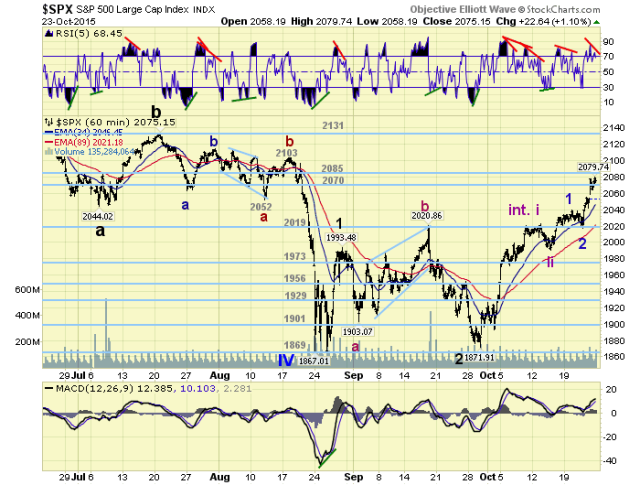
When Major wave 3 got underway, we counted 9 waves up to SPX 2022. The first four waves were of a Minor degree, and Minor 5 subdivided into five Minute waves. This advance ended Int. wave i. Then after an Int. ii pullback to SPX 1991 Int. wave iii got underway.

We have labeled Minor waves 1 and 2 at SPX 2039 and 2017 respectively. Minor wave 3, however, has started off by subdividing into five waves. Thus far we have observed: 2055-2042-2078-2064-2080. This could be most of Minor 3, or Minute i of Minor 3. Too early to tell until we observe some more price activity. Short term support is at the 2070 pivot and SPX 2040, with resistance at the 2085 and SPX 2100. Short term momentum ended the week with a negative divergence.