REVIEW
The market started the week at SPX 2092. After a gap down opening on Monday, the market quickly recovered to hit SPX 2103. It traded at that level again on Tuesday, and then ran into three straight gap down openings for the rest of the week. On Friday, the SPX hit 1971 and closed there. For the week, the SPX/DOW were -5.8%, the NDX/NAZ were -7.1%, and the DJ World index was -5.3%. On the economic front, reports came in slightly to the positive. On the uptick: the NAHB, the CPI, housing starts, existing home sales, the Philly FED and the GDPN. On the downtick: the NY FED, building permits, leading indicators, the WLEI, plus weekly jobless claims rose. Next week’s reports will be highlighted by the next report on Q2 GDP, Durable goods, and PCE prices.
LONG TERM: bull market
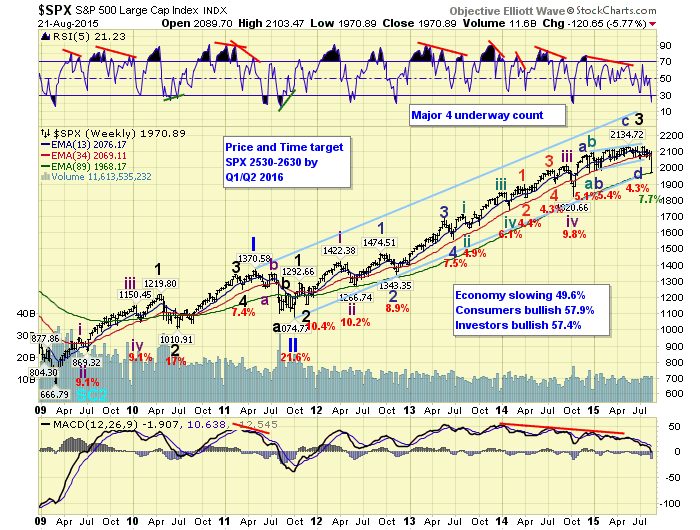
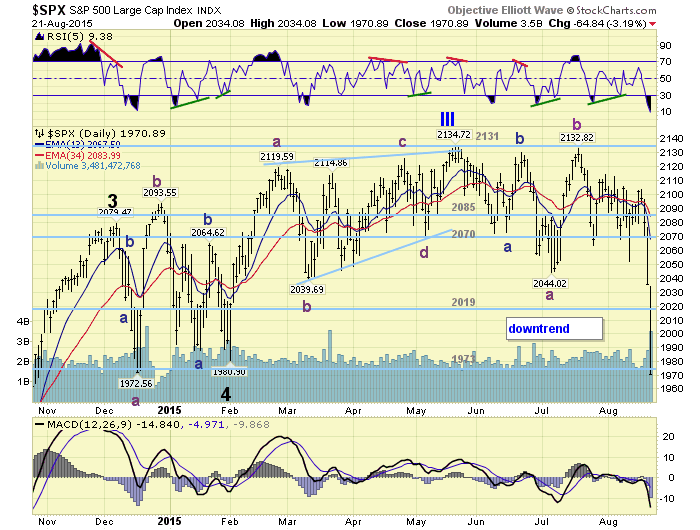
Last weekend, we introduced a third corrective count: Major wave 4. This new count, along with the Intermediate wave ii and Primary IV counts, all suggested defensive positions as the market would likely be heading lower soon. We gave four levels of support with varying wave degree implications: the low SPX 2040’s, the 2019 pivot, the 1973 pivot, and SPX 1820. Three of these levels were hit as the market moved to the downside this week.
Breaking the first two levels suggested the Intermediate wave ii, subdividing Major wave 5 labeling, could be eliminated. We held this count for most of the year as we had expected the ECB’s EQE to stimulate the US stock market, as well as Europe. After months and months of choppy action, it was quite obvious this was not occurring. A little over a month ago, we introduced the Primary IV count as four of our long term indicators had turned negative. Soon after, one of those indicators reversed higher. Now, this week, a different set of long term indicators turned negative. So this count is still viable and remains posted on the SPX daily chart. A Primary IV correction would suggest a decline back to the October 2014 lows around SPX 1821.

A Major wave 4 correction still fits the wave patterns in all four major indices. It does not display a compressed Major wave 4 and short diagonal Major wave 5, as labeled with the Primary III May top count. It suggests all the price activity from the October Intermediate wave iv low was a diagonal triangle Intermediate wave v, in both the DOW and SPX. While the leading NDX/NAZ impulse from that low in five waves. Either way, the market is clearly downtrending again after months and months of choppy activity.
We continue to label this six year bull market as a five primary wave Cycle [1]. Primary waves I and II completed in 2011, and Primary wave III has been underway, or recently completed, since that October 2011 low. If Primary IV is underway, it should end with the largest percentage correction since 2011. All corrections in the SPX, since Primary II, have been limited to 10.4% or less. If Major wave 4 is underway, it should end with less than a 10.4% correction.
MEDIUM TERM: downtrend
For months on end, the market remained in a choppy pattern, even through Wednesday of this week. After the FOMC minutes were released on Wednesday, the market rallied to SPX 2096. Then with Thursday’s gap down opening, and losing the six month support level at SPX 2040 at the close, the market tumbled during Friday’s options expiration.

While our long term sector indicators are not aligned with a Primary IV scenario, the technical indicators are getting there. The SPX weekly MACD has now joined the DOW and turned negative for the first time since 2011. The SPX monthly MACD remains on a sell signal with the DOW, and the RSI is also heading toward an oversold level not seen since 2011. The market will need a sharp reversal next week to keep these indicators from collapsing further.
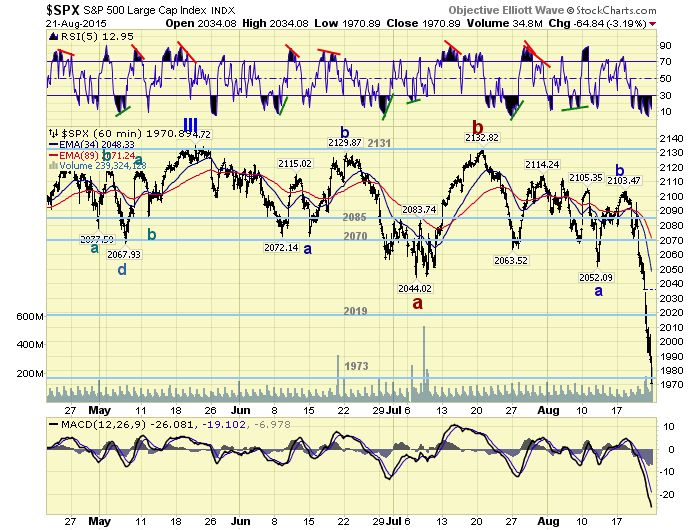
With the drop below the SPX 2040 level at Thursday’s close, the subdividing Major wave 5 scenario was eliminated. Especially with the DOW completely retracing its uptrend by Thursday’s close. Since the market has turned weak late-Thursday through Friday, we are favoring the Primary IV scenario, and updated the hourly chart with that count. The weekly chart continues to display the Major wave 4 scenario. To keep that count alive, the market needs to rally strongly next week, without breaking down too much further. Similar to what it did at the Major wave 2 low. Medium term support is at the 1956 and 1929 pivots, with resistance at the 1973 and 2019 pivots.
SHORT TERM
With Thursday’s/Friday’s market activity, we not only updated the hourly chart to match the daily chart, but also shifted the first significant wave of the downtrend over to the SPX 2052 level. This would put it more in proportion with the recent selloff. At Friday’s SPX 1971 low Minor C is within one point of a 1.618 relationship (1972) to Minor A. Should the 1973 pivot range hold, the market could experience a good rally next week. If not, the 1956, 1929 and even 1901 pivots would be next.

After four years of a rising market, and the loss of the six month support at SPX 2040, it appears many are hedging or simply taking profits. Short term support is at the 1956 and 1929 pivots, with resistance at the 1973 and 2019 pivots. Short term momentum ended the week extremely oversold.