REVIEW
The market started the week at SPX 2000. After reaching SPX 2006 on Monday the market traded down to 1977 on Tuesday. Then after two gap up openings the market traded up to SPX 2005 on Thursday before selling off to 1969. By Thursday afternoon the market reversed and was making new uptrend highs, at SPX 2022, on Friday. For the week the SPX/DOW were +1.15%, the NDX/NAZ were +0.75%, and the DJ World index was +1.0%. Economic reports for the week again were slightly negative. On the uptick: wholesale inventories, the WLEI, plus weekly jobless claims improved. On the downtick: consumer credit, export/import prices, plus the budget deficit widened. Next week’s reports will be highlighted by the FOMC meeting, Industrial production and the CPI.
LONG TERM: bear market
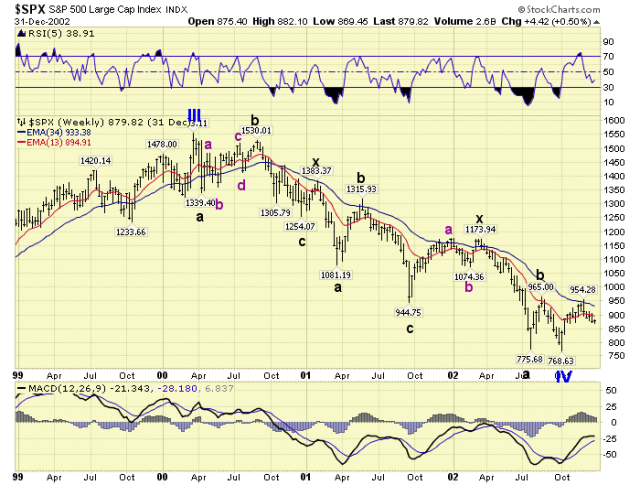
During the past couple of weeks some have started to question the bear market scenario. The market has been in a four week uptrend, the economy is still positive, commodities have rebounded, market breadth has been rising, and the market has only corrected 15% from the bull market high at SPX 2135. To address the current situation let’s look at the previous two bear markets: 2000-2002 and 2007-2009.
In the year 2000 the SPX peaked at 1553 in March. It sold off 13.7% to start the bear market. Then it spent several months retracing 89% of that decline into Q3 2000. After that the market had a downtrend into Q4 2000, for a 19.3% loss from the high, and then the bear continued to work its way lower into October 2002. The economy was positive throughout 2000, and was not reported negative until Q2 of 2001. Commodities were rising throughout and peaked in Q4 2000. Market breath had been declining since 1998, made a low in Q2 2000, and then rose throughout the bear market.
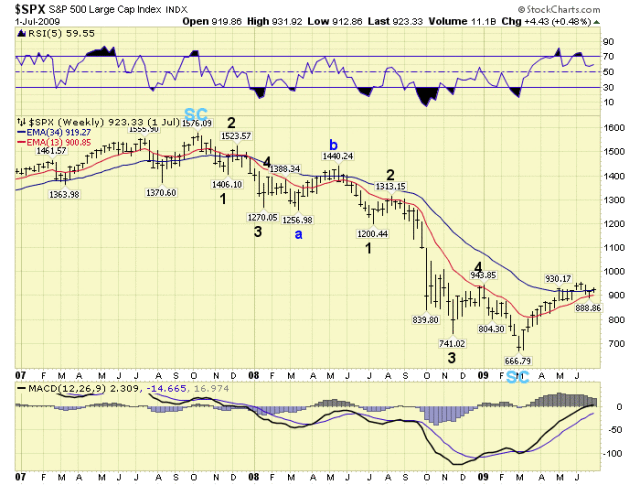
In the year 2007 the SPX peaked at 1576 in October. It sold off 10.7% to start the bear market. Then it retraced 69% of that decline in just two weeks. After that the market had a downtrend into Q1 2008, for a 19.4% loss from the high, and the bear market continued to work its way lower into March 2009. The economy was positive throughout 2007, and was not reported negative until Q2 2008. Commodities were rising throughout and peaked in Q2 2008. Market breath had peaked in Q2 2007, and then bounced around with the market as it worked its way lower.
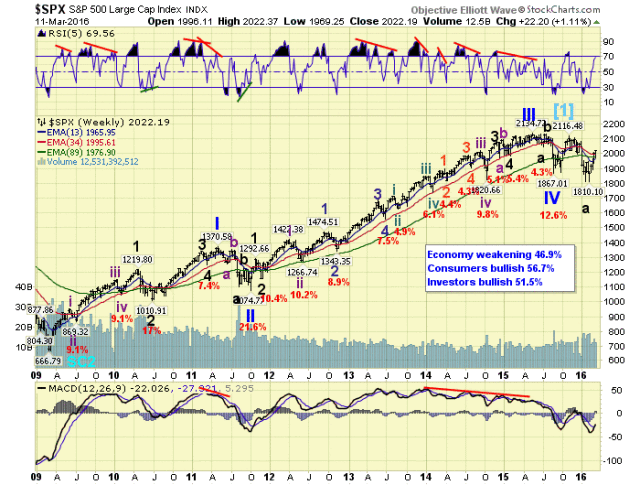
When the economy is positive at the start of a bear market, the first downtrend is not alarming and appears to be only a correction. That downtrend is then retraced quite a bit, as the “it’s only a correction” mentality remains the primary focus. The next downtrend creates a more substantial market loss, and then a few months later the economy is reported negative. While commodities have typically peaked after the stock market peaked, commodities this time peaked in Q2 2014 after several years of going sideways. Market breadth which usually peaks before a stock market peak, can also decline during a bull market and rise during a bear market. During the recent bull market breath peaked in Q2 2015. While the current uptrend has retraced 65% of the decline from the SPX 2135 bull market high, the market activity still looks quite normal for the beginning of recent bear markets.
MEDIUM TERM: uptrend
The Major wave B uptrend that started off the SPX 1810 Major A low surprisingly continues. We originally thought it would last about three weeks, and could top out around the 1973 pivot or SPX 1999 (61.8% retracement A). After completing Intermediate wave A, of the three Intermediate wave uptrend, we calculated two additional resistance levels: the 2019 pivot and SPX 2028.
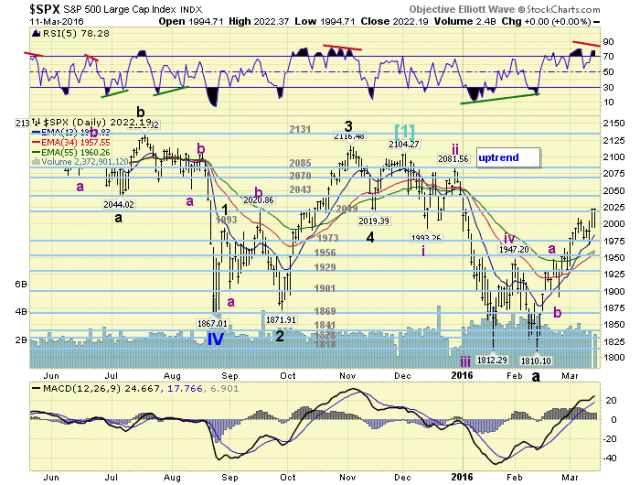
The 2019 pivot range appeared to be a logical stop, as Int. wave C would then equal Int. A at SPX 2028. Last Friday the market stopped at SPX 2009, and we gave some consideration to that being the high. But this Friday the market closed at the uptrend high of SPX 2022, which is right inline with the upper range we anticipated. Reviewing the charts we noticed the weekly RSI is now overbought, and the MACD is still well below neutral. Typical B wave bear market action. The daily chart displays a developing negative divergence at the uptrend high, and its MACD is quite overbought. The potential for a Major wave B top has set up in price and momentum. Should the market exceed SPX 2028, there is little resistance until the 2043 and 2070 pivots. Medium term support is now at the 2019 and 1973 pivots, with resistance at the 2043 and 2070 pivots.
SHORT TERM
We had been labeling the short term activity as a series of zigzags for Intermediate waves A, B and C. This week’s activity, however, has stretched that potential count to its limits. We now think it is best to look at the uptrend as a much simpler zigzag. Five waves up to SPX 1947 for Int. A, an Int. B pullback to SPX 1891, then another five waves up for Int. C. This count appears to be more appropriate for the current short term wave pattern.
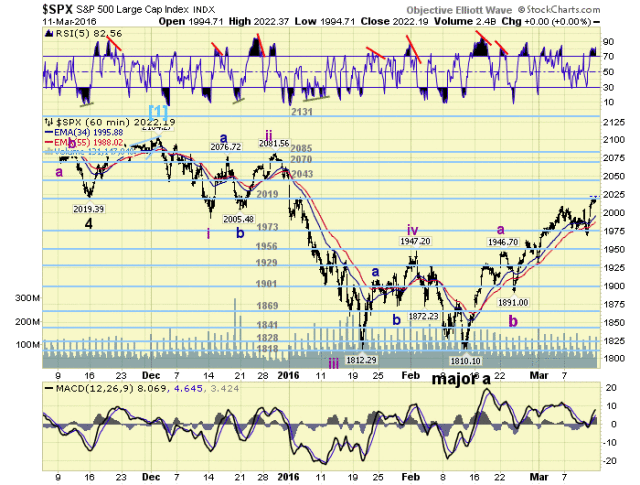
Short term support is at the 2019 and 1973 pivots, with resistance at SPX 2028 and the 2043 pivot. Short term momentum ended the week quite overbought. Best to your trading!