- Trade concerns loom, but analysis paints a mixed picture
- A portion of the yield curve inverted
- OPEC agreed to cuts, boosting oil for a second week
Stocks in the US wrapped up their worst week since March on trade war fears, a disappointing jobs report and a flattening yield curve that is often the red flag for an upcoming recession. Oil extended its rebound into a second week after OPEC agreed to reduce production.
The S&P 500 Index fell 2.33 percent Friday led by Technology (-3.52%). Utilities (+0.37%) outperformed, followed by Energy (-0.56%) amid the news of OPEC’s agreement. On a weekly basis, the index dropped 4.6%, its worst setback since March, when the trade war began. Financials (-6.90%) were hit the hardest after Fed Chief Jerome Powell’s recent dovish turn. Industrials (-6.22%) were close behind due to its sensitivity to tariffs. Technically, the S&P 500 fell to 0.02% above the Nov. 23 close, the lowest since May 2, as the 50 DMA crossed below the 200 DMA, triggering a feared Death Cross. Should prices fall below these levels, it would be akin to the opening shot of a race to further selloffs.
The Dow Jones Industrial Average declined 2.24 percent and 4.5 percent for the week. Its parallel drop to the S&P should serve as a contrarian indicator to the narrative that selloffs are solely due to trade fears, as the 30 biggest companies listed on its index should have taken a markedly bigger hit relative to the S&P. Also, its technical picture is stronger, closing 0.49 percent higher than the Nov. 23 close. The gauge has yet to post a Death Cross.
The Nasdaq Composite fell 3.05 percent, making it the clear underperformer. Technically it executed a Death Cross last week.
US SmallCap 200 Weekly Chart
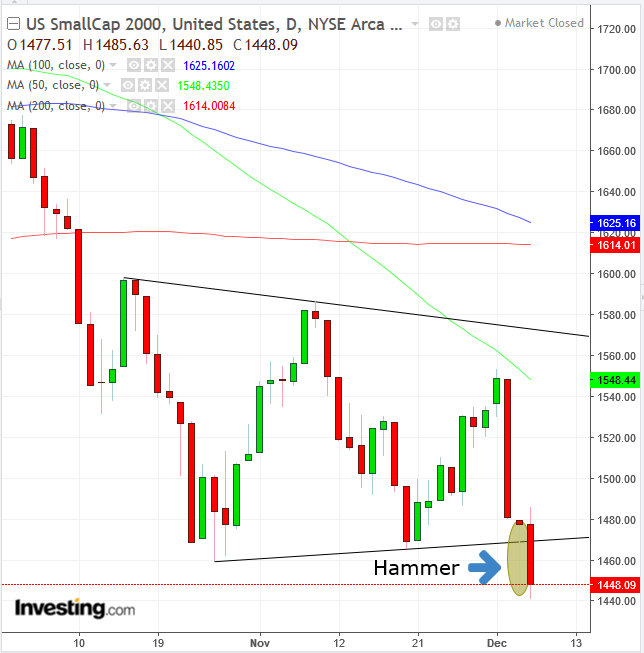
The Russell 2000 slumped Friday 1.72%, making it the outperforming index. However, its 5.56% plunge for the week renders it the weekly underperformer. Technically, the small-cap index provides the weakest picture, falling to its lowest since September 2017, having been the first to post a Death Cross last month and posting the lowest close since Sept. 21, 2017. Last week’s decline completed a symmetrical triangle, bearish in a downtrend, suggesting a minimum of another 7% selloff, should prices breakthrough Thursday’s hammer’s support.
VIX Daily Chart
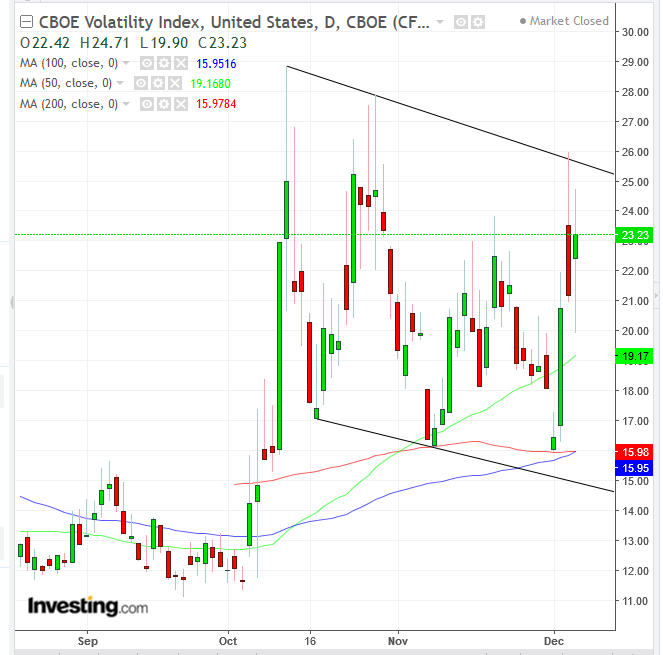
We see a positive omen that despite the headlines on volatility, last week’s declined, even amid the selloffs. Moreover, since October, volatility highs and lows have been in decline. Might the market be shaking out its weak hands?
United States 2 Year VS 3 Year Treasurys Daily Chart
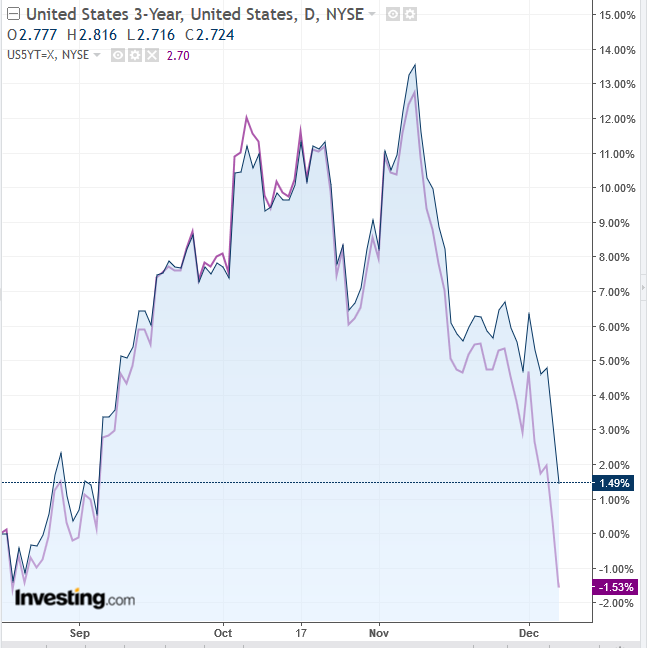
The other key issue that unnerved investors was the U.S. Treasury curve as the 3-year rates exceeded 5-year rates, raising fears of an inverted yield curve. While we are not dismissive of the risks, we think that such predictions are premature. While investors should keep abreast of the yield curve development, a more reliable measure to monitor is short-rates (3-month) compared to 10-year rates, as these are more representative of Fed rate moves and long-term growth expectations. This yield curve is flatter, but is still positively-sloped.
The US added 155,000 new jobs last month. While this number significantly missed the 200,000 estimates, unemployment held steady at 3.7 percent, a 49-year low, which supports wage growth. Average hourly earnings rose 0.2% MoM, missing the 0.3% forecasts, though wages matched projections on an annual basis, up 3.1% for a second month. Our key takeaway is that wage growth held steady despite a slowdown in hiring.
DXY Daily Chart
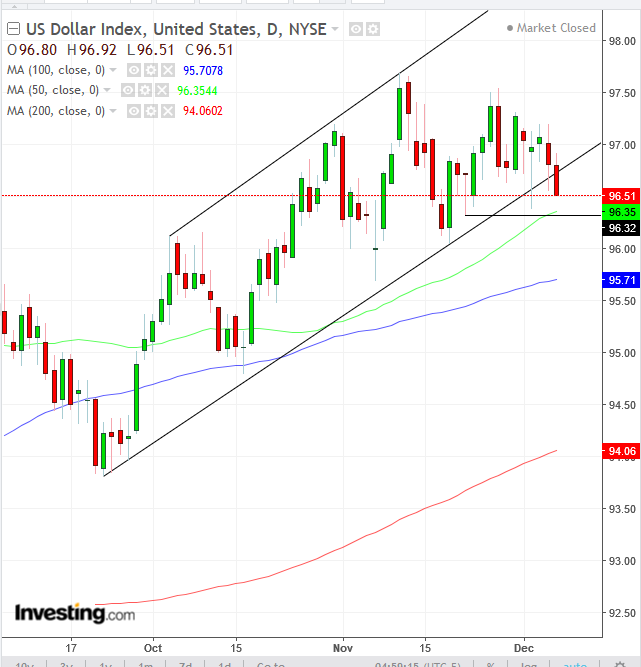
The 10-year yield closed at the lowest level since August, pulling down the dollar with it, closing below its rising channel since October for the first time. However, a price cluster since November 22 and the 50DMA provide support.
WTI Weekly Chart
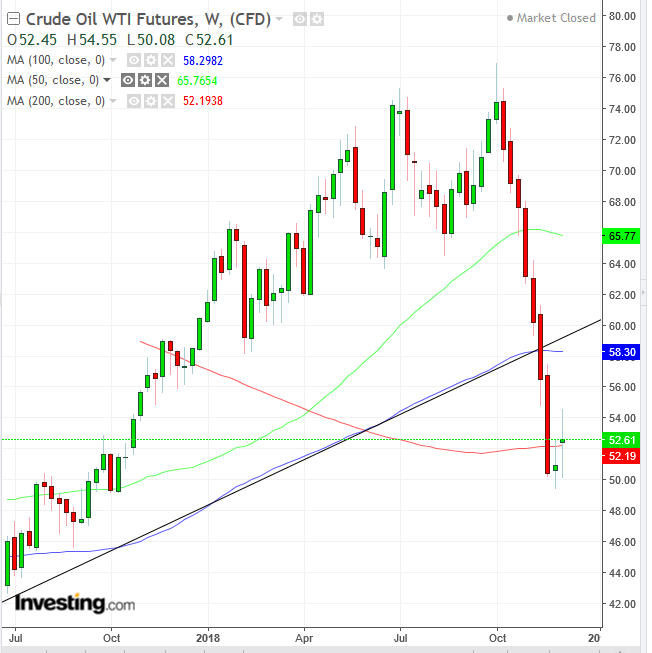
Finally, the week ended with an OPEC agreement to cut oil production. Technically, the weekly price action climbed back above the 200-week MA, but the onus is on bulls after falling below its long-term uptrend line since the February 2016 bottom of $26.05.
Week Ahead
Monday
4:30 – UK GDP (October): growth expected to be 0.1% from 0.0% MoM and 1.6% from 1.5% YoY for the 3-month period.
19:30 – Australia NAB Business Confidence (November): index to rise to 10 from 4.
Tuesday
Time TBC – UK House of Parliament vote on Brexit Withdrawal Agreement: currently this is not expected to pass, in which case the PM may be forced to go back to Europe for more negotiations. A failure may result in a no-confidence motion. While it is widely expected that the deal will fail to get through, increased volatility is likely.
4:30 – UK Employment Data: Average Earnings Index + Bonus expected to remain steady at 3.0%, Claimant Count Change (Nov.) seen to fall to 13.2K from 20.2K and the Unemployment Rate probably remained steady at 4.1 for October.
5:00 – German ZEW (December): economic sentiment to further decline to -25.0 from -24.1
8:30 – US PPI (November): factory-gate inflation to rise 0.0% MoM, from 0.6% last month. Markets to watch: USD crossed
Wednesday
13:30 – US CPI: CPI to rise 2.2% YoY from 2.5%, and 0.1% from 0.3% MoM. Core CPI to remain at 0.2% MoM and rise to 2.2% YoY.
19:30 – RBA Bulletin: the RBA will update on its view of the Australian economy.
Thursday
7:45 – ECB Rate Decision: no change in policy expected, but with increased market volatility and a continuing stand-off with the Italian government dominating the news, the press conference may provide some insight about whether the bank is still confident about moving on rates later next year.
18:50 – Japan Tankan Large Manufacturers Index (Q4): index to rise to 17 from 19.
21:00 – China Retail Sales (November): expected to increase by 8.8% from 8.6% YoY.
Friday
3:15 – 4:00 – French, German, Eurozone PMIs (December, Flash): German Manufacturing PMI to rise to 51.7 from 51.8.
8:30 – US retail sales (November): forecast to rise 0.1% MoM from 0.8%.
