- Stocks accelerate on Biden promise of additional stimulus
- Bitcoin tops $40K, hits new record doubling value in just weeks
- Yields move beyond 1% for the first time since March, slowing dollar decline, dealing gold a blow
Most US equities advanced on Friday to new all-time highs after President-elect Joseph Biden put expectations of $2,000 stimulus checks back on the table as the Democrats gained control of both chambers of Congress.
The S&P 500 Index climbed, (+0.5%), for the fourth day in a row, along with retail and real estate firms to notch both an all-time high and a record close, which occurred near the top of the session.
From a technical perspective, however, Friday’s trading pattern may be an early warning signal:
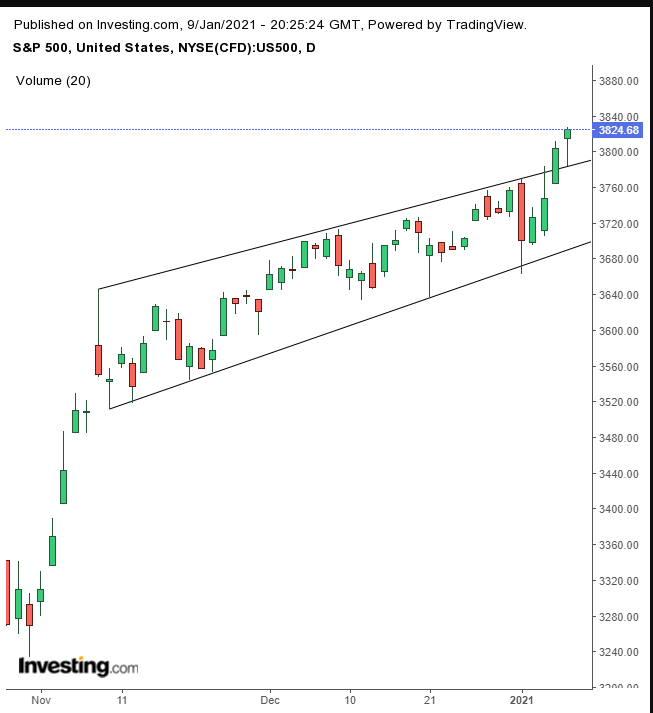
The SPX formed a hanging man. Should Monday’s candle close below Friday’s real body—the opening price—it would confirm the bearish nature of the pattern. The pattern suggests that traders who bought in on Friday’s rebound were “left hanging,” meaning they bought too high and were losing money. Should they sell on Monday, it would increase the pressure, potentially triggering a sell-off.
On the other hand, the top of the rising channel may provide support.
The Dow Jones Industrial Average also advanced for a fourth straight day, (+0.2%). But while the mega cap index scored a new record close, it failed to outdo Thursday’s all-time high.
As for the NASDAQ Composite, though it jumped on Friday, (+1%), it was only the second day of gains for the tech-heavy index. Still, like the S&P 500, it closed near session highs, notching a dual record on both a closing basis as well as for an intraday high.
The NASDAQ 100 outperformed, (+1.3%), with Tesla (NASDAQ:TSLA) surging 7.8%, its 11th consecutive rally. Shares of the Palo Alto, California-based electric vehicle maker gained $60 billion in market cap on Thursday alone, the entire market valuation of General Motors (NYSE:GM).
The EV manufacturer has added almost 25% in value since the beginning of 2021, which is barely ten days old, and has doubled in price since mid-November, making Elon Musk now the richest man in the world. Billionaire investor and CEO of Virgin Galactic, Chamath Palihapitiya predicts the price of Tesla’s stock will still triple in value.
On the other hand, Michael Burry, chief at Scion Asset Management and the man who predicted and shorted the 2007 housing bubble—depicted in the movie “The Big Short”—is now short Tesla too. He warns it will suffer a similar downfall.
The small cap Russell 2000 Index underperformed on Friday, (-0.4%), the only major US index to finish the week's final day of trade in the red. It's been on the opposing side of tech shares during the cyclical rotation in markets. However, on a weekly basis, small caps and international stocks outperformed, signaling optimism around the outlook for the post-vaccine economy.
Markets 2021: How It Starts Isn't Necessarily How It Ends
While global stock markets enjoyed a powerful start to the year, it’s important to remember the beginning of a year is a social construct and doesn’t project in any way how the year will end. Still, the Democratic control of Congress—with Vice President-elect Kamala Harris being able to cast the tie-breaking vote in the Senate which will now have a 50-50 distribution of Democrats vs Republicans—will likely enable President-elect Biden to push a third round of stimulus “out the door.”
On the other hand, if Democrats make good on their agenda for higher taxes and stricter regulations, they might offset any benefit from the added stimulus. Nonetheless, given they also have an uphill battle for an economic recovery, Democrats might wait for better timing for policies considered unfriendly to business growth.
For now, investors remain bullish. They continue to be willing to buy stocks at the most expensive levels on record, even amid political uncertainty, mixed economic data and pandemic lockdown stress.
Traders appear to be keeping narrowly focused on further stimulus and a post-vaccine recovery.
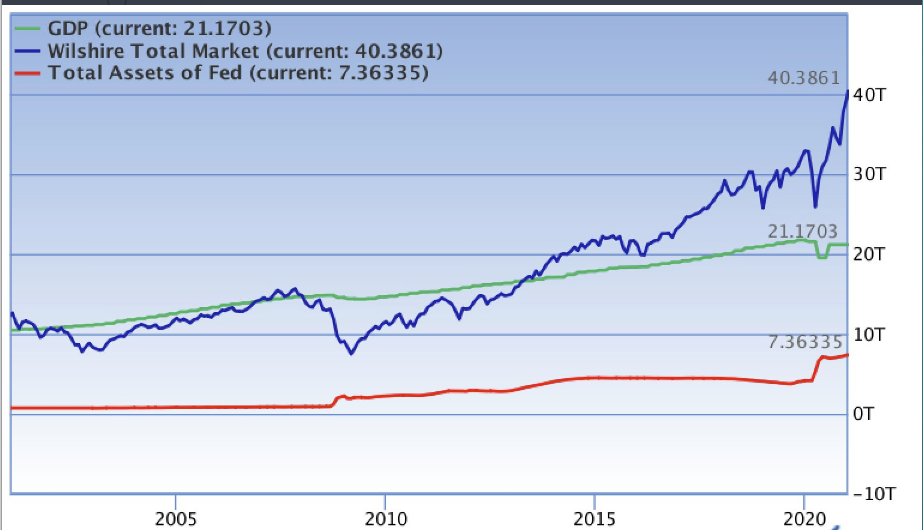
Chart courtesy @Northman Trader
It is noteworthy, however, that the US stock market is now valued above $40.4 trillion, while the country's GDP is less than $21.5 trillion. Allianz's chief economic adviser Mohamed El-Erian warns:
"I’ve never seen markets so disconnected from the economy."
Just recently, for the first time in almost ten months, 10-year Treasury yields climbed above 1%. Astonishingly, rates surged for the last four days of the just-finished trading week, to close just a hair below 1.2%. Last week saw the biggest advance for yields since the first week of June.
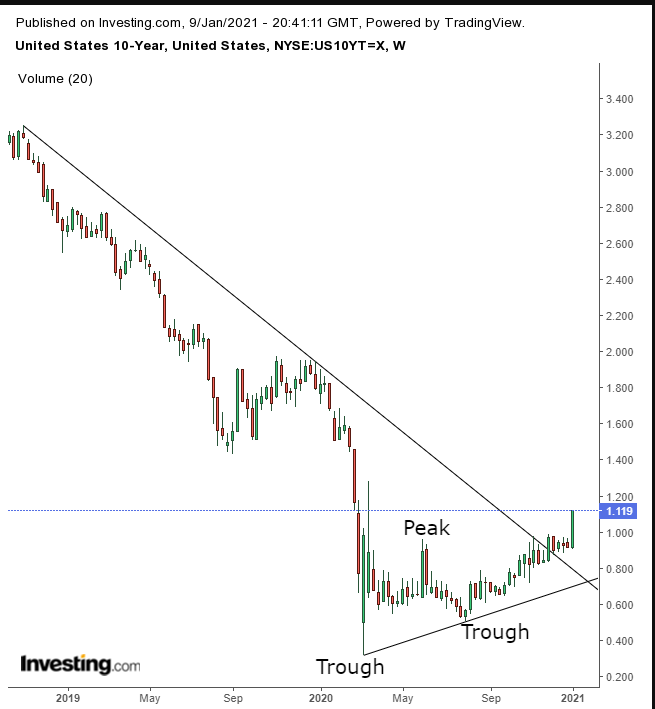
Technically, yields are now in an uptrend.
Analysts expect last week's blue wave will add pressure to an already weakening dollar with higher inflation and even looser monetary policy. Still, the geenback climbed for a third straight day on Friday, for the first time in two-and-a-half weeks, boosting the global reserve currency's weekly result.
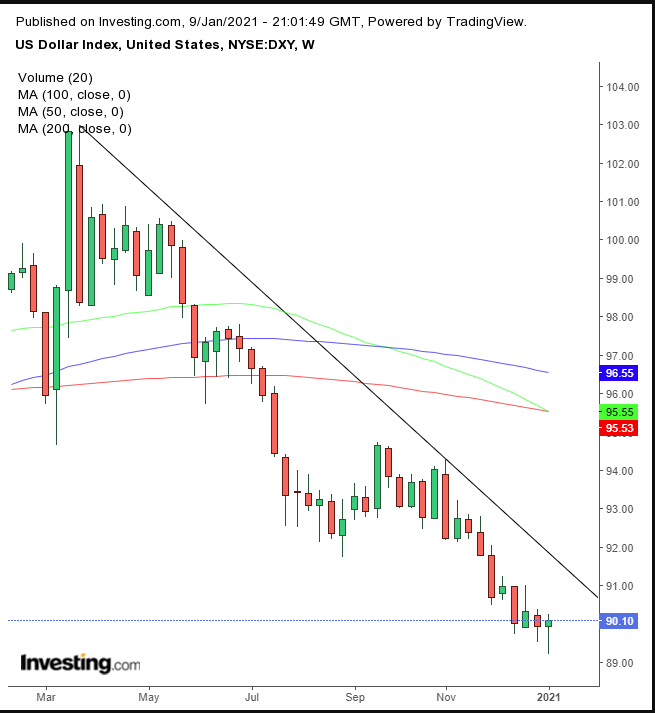
The USD finished the week by producing an imperfect hammer (with a superfluous, smaller upper shadow), just as the 50-week MA landed on the 200-week MA, threatening a major Death Cross, for the first time in nearly three years, preceding a 5% decline.
Gold went into free-fall on Friday, erasing weekly gains and losing 4.1%, the most since November. It wasn’t just dollar strength combined with risk-on appetites that weighed on the precious metal. As well, it was the leap in yields increasing the odds of support to the US dollar, as higher rates make a low-yielding dollar more attractive than non-yielding gold.
This follows after the yellow metal saw its biggest annual gains in a decade during 2020 when it posted its first all-time high since 2011, during August.
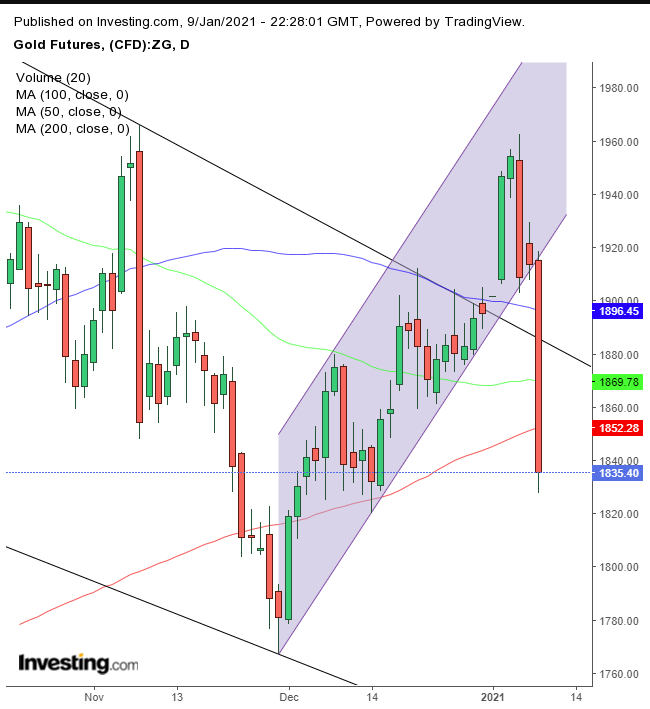
From a technical perspective, gold dropped out if its short-term rising channel, right back into its medium-term falling channel, as well as below the 200 DMA. On the weekly chart however, gold remains above the 50-week MA, which marks the long-term uptrend line.
Bitcoin continues to make history. The cryptocurrency closed above $40,000 on Friday, doubling in value from the $20K milestone it hit just a little over three weeks ago.
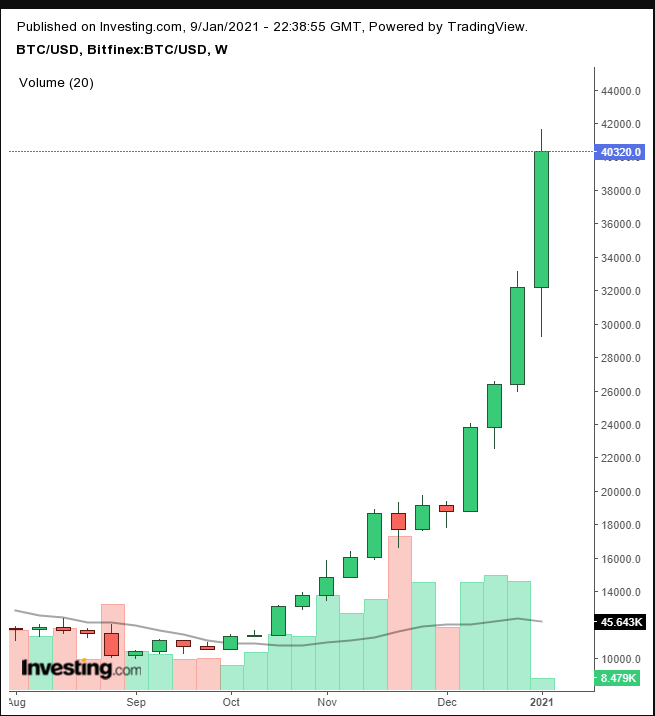
Though we admit we've been urging caution on the digital token since it crossed $20,000, even as it's now doubled in value, we feel we must stay true to our judgement. There is no way to ride this wild horse safely. Last week alone, Bitcoin surged a mind-boggling 25.1%. Notice the recent sharp drop in volume on the chart above—that's a bright red flag.
It’s noteworthy that Tesla and Bitcoin have exploded in unison.
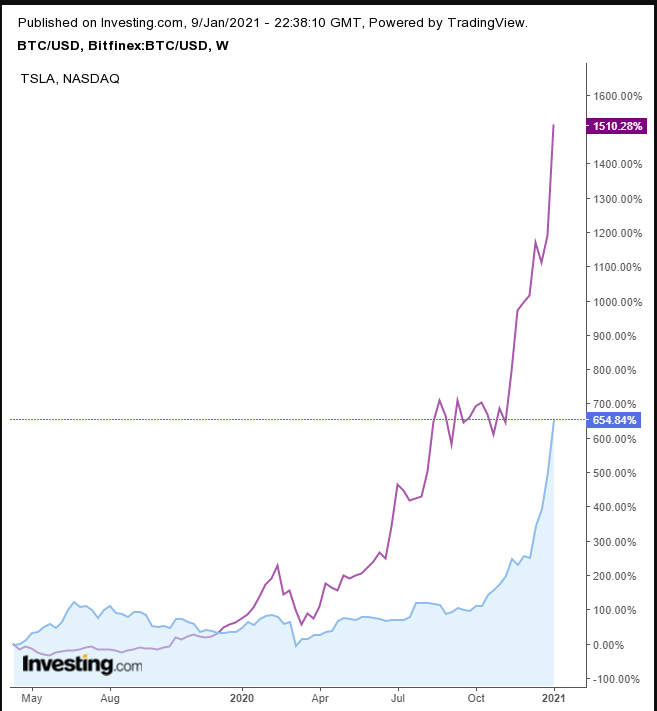
Mad Money’s Jim Cramer has claimed that Tesla shares are being driven by young investors buying into Elon Musk’s alt-energy dreams. Well, Bitcoin is also generally a young investor’s asset. However, when assets spike like this it’s impossible to predict when a decline may occur, if not an outright pop of the entire bubble.
Oil finally pushed past the psychological $50 mark for the first time since February, after the pandemic sent shock waves through global economies and markets. Saudi Arabia’s unexpected production cut announcement last week compounded expectations of a return to economic normalcy after the global distribution of vaccines.
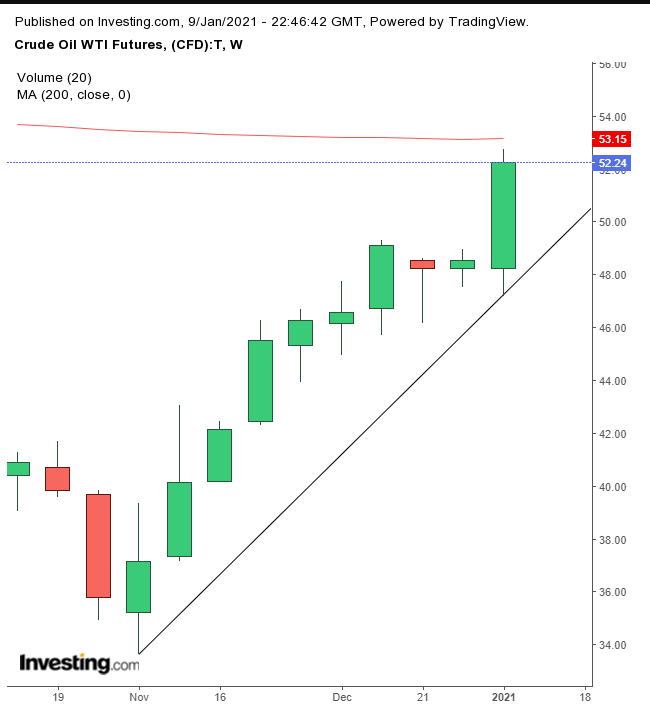
Technically, WTI gained for the fourth straight day on Friday, moving past $52 and inflating the RSI toward the overbought condition of 74. On the weekly chart, the commodity retreated from the 200-weekly MA, below which it had fallen in January.
The Week Ahead
All times listed are EST
Sunday
19:30: Australia – Retail Sales: expected to drop to 1.6% from 7.0% previously.
Monday
18:50: Japan – Current Account: anticipated to slip to 1.551T.
Tuesday
10:00: US – JOLTs Job Openings: previously printed at 6.652M.
Wednesday
8:30: US – Core CPI: likely declined to 0.1% from 0.2%.
10:30: US – Crude Oil Inventories: seen to surge to -2.133M from -8.010M.
Thursday
2:00: Germany – GDP: previous release showed quarterly growth of 8.5%.
7:30: Eurozone – ECB Monetary Policy Statement
8:30: US – Initial Jobless Claims: seen to dip to 780K from 787K.
Friday
2:00: UK – Manufacturing Production: predicted to drop to 1.0% MoM from 1.7%.
8:30: US – Core Retail Sales: to advance to -0.1% from -0.9%.
8:30: US – Retail Sales: will probably climb to -0.2% from -1.1%.
