With no negative headlines to pressure markets, little resistance and low trading volumes during the final, full trading week of 2019, the S&P 500 is on track to match 2013's 29.6% return, the best performance of the decade for the benchmark to date. During last week's trading, U.S. indices, including the SPX, Dow and NASDAQ, hit all-time highs, allowing stocks to keep gliding upward, fueled by central bank accommodation and the promise of a U.S.-China trade deal.
Historically, stocks have risen by an average of 7.0% during the year following a 25% or higher return, but in 2014 the market still gained 11.39%, indicating that good returns don't have to be followed by bad ones. However, given current lofty valuations, we think investors need to incorporate lower expected long-term rates of return into their strategies.
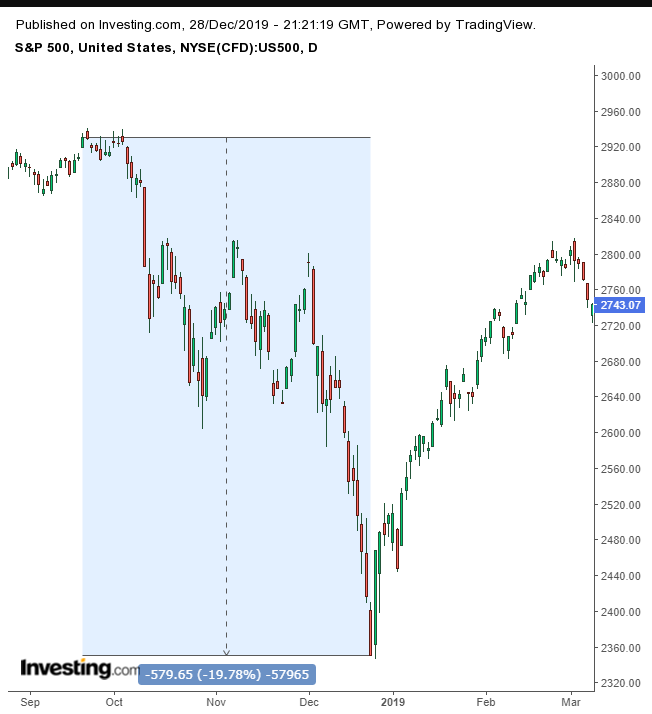
Near 20% Correction As 2018 Closed; Near-Record Returns As 2019 Ends
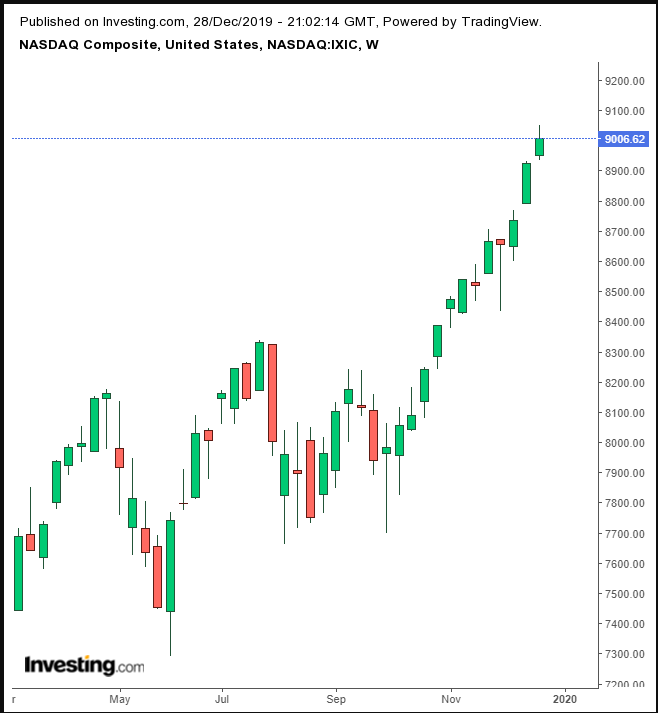
For the first time on Thursday, the NASDAQ bested the 9,000 level. Amazon.com (NASDAQ:AMZN) was among the top equity performers after the e-commerce giant reported a “record breaking” holiday season.
While the calendar does not substantively dictate market cycles, it does have a psychological effect. As the year comes to a close, shareholders and clients of institutional investors in particular generally take “stock” of the performance of their investments. In many ways, 2019 was like 2016—stocks at record highs with risk to the downside, but exuberance just keeps pushing prices higher.
While we recognize that the Fed’s policy reversal has a profound impact on markets, both from the perspective of the growing money supply—with downside risk diminished on the promise of continued accommodation—such policy has always been used to combat roaring inflation, never as a way for the Fed to attempt to stoke inflation. This disconnect, with the Fed’s loosening despite no economic call for it, is taking us to a place where investors have never gone before.
Case in point: we can’t recall another market theme that has disappointed investors so many times and yet they've continued buying it.
This past year featured 34 new record highs for the S&P 500, following a late December correction that was barely below the arbitrary 20% gauge for a bear market, 2018's worst Christmas Eve on record.
Since 2013, when the market fully recovered from the pre-2008 crash, returning to the 2007 high, the SPX has hit all-time highs 271 times. That's a mind-boggling 16% of all trading days during which the phenomenon occured, according to FactSet. Analysts take this to indicate that new highs are not indicative of exhaustion.
These records were driven to a fair degree by 126 months of economic expansion. Indeed, this past June, U.S. growth overtook the robust numbers made during the 1990s, claiming the record. Economists attribute the easy-does-it, or Goldilocks economy for the occurrence.
When growth overheats it burns out. But if it's kept at simmer, it can last and last—and apparently last.
What has supported growth is the lowest unemployment rate since the 1960s, now at a 50-year low. The U.S. labor market has expanded by 2 million jobs, allowing consumers to remain confident and keep spending. Which is a good thing for the nation's economy since consumer spending makes up 65% of American GDP.
The irregular circumstances—low inflation coupled with low interest rates—resulted in something highly uncharacteristic, no 10% stock correction during the year. Indeed, the S&P experienced only two modest pullbacks, a 6.8% drawdown in May and 6.1% in August.
For historical comparison, corrections in the stock market, defined as a decline of 10% or more, have occurred, on average, about once a year. Also reflecting the low degree of fluctuation this past year, the S&P 500 experienced only seven daily moves (up or down) of 2% or more in 2019, compared with an average of 19 over the past 20 years, according to FactSet.
Another factor that boosted global demand for U.S. assets: world GDP growth that decelerated to roughly 3%, the slowest global growth in 10 years, attributable directly to the trade spat.
Treasury yields, on the other hand, were halved from the November 2018 highs to the September 2019 lows. Which is strange, considering yields should rise along with equities, as both accelerate on reduced risk.
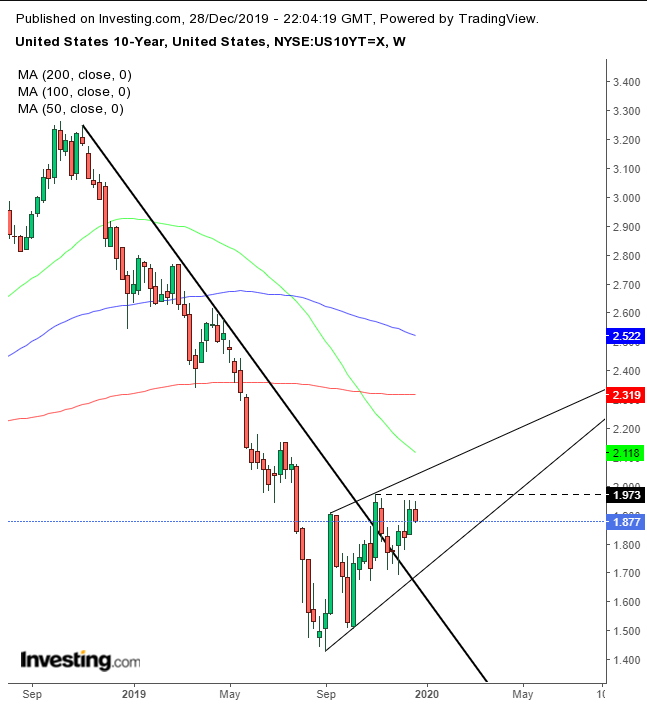
In early November rates on the U.S. 10-year note ascended above the downtrend line since the November 2018 peak but have been unable to best the November 2019 highs, and have been stuck between the two trends. On Friday, they fell back below the 200 DMA.
In October the 50 WMA fell below the 200 WMA, triggering a rate death cross on the weekly chart, for the first time since 2015. Also, on the weekly chart, yields are developing a rising wedge, bearish following the 55% drop between the November 2018 highs and the September 2019 lows.
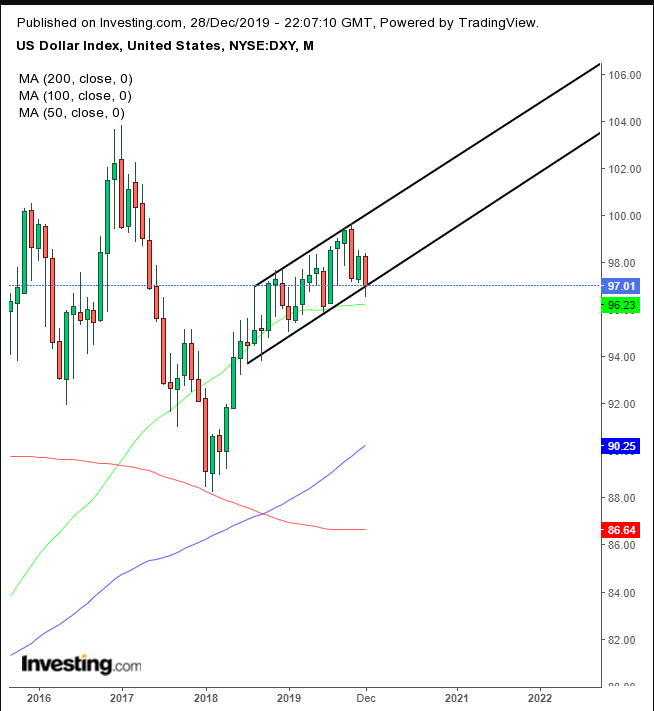
The U.S. Dollar Index ended the week almost flat, rising less than 1%. However, at the same time, the greenback developed a rising channel, whose bottom is being tested. On the one hand, the Fed’s reversal of the path to interest rates weighed on the dollar, though, on the other hand the demand for Treasurys as the most reliable safe haven helped prop up the global reserve currency.
Oil is up almost 36% for the year. Oversupply due to a global slowdown and U.S. shale production provoked a selloff during the course of the year. However, central bank accommodation and trade agreement hopes, with recent data bolstering the argument for global growth, pushed oil up 11.7% this month.
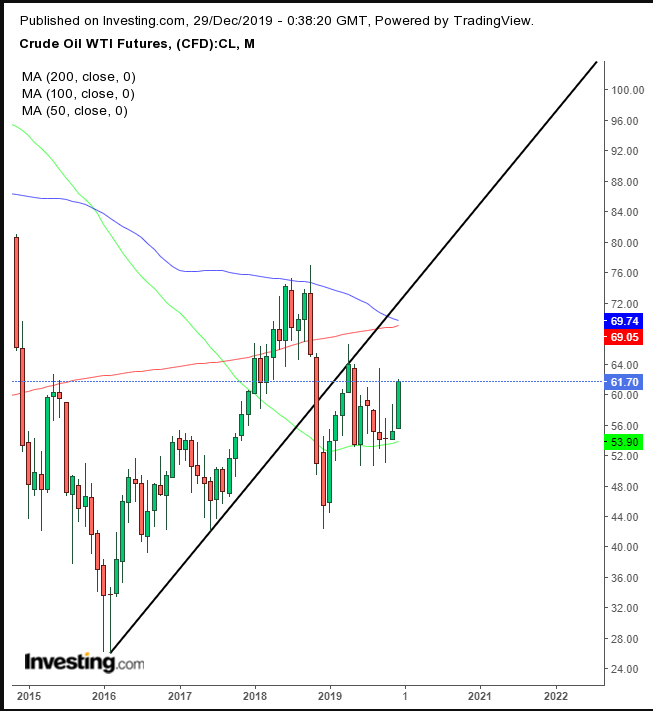
While the commodity's three-month plunge from October through December 2018, which mirrored the wild equity selloff during the same period, has been trimmed, crude is still down more than 15% from the $75 highs. A monthly death cross, visible on the chart above, preceded that selloff. It was the first one since the monthly golden cross in early 2001.
The Week Ahead
All times listed are EST
Monday
10:00: U.S. – Pending Home Sales: expected to jump to 1.1% in November from -1.7% previously.
20:00: China – Manufacturing PMI: seen to edge lower, to 50.1 from 50.2, to teeter just above the minimum threshold for expansion.
Tuesday
Many global markets, including Australia, South Korea, Japan, Hong Kong, Germany, France and UK closed for New Year's Eve day.
10:00: U.S. – CB Consumer Confidence: likely to rise to 128.2 from 125.5.
Wednesday
U.S. and global markets closed for New Year's Day holiday.
20:45: China – Caixin Manufacturing PMI: probably edged down to 51.7 from 51.8.
Thursday
Markets closed in Japan, New Zealand, Russia, Switzerland.
3:55: Germany – Manufacturing PMI: forecast to remain flat at 43.4.
4:30: UK – Manufacturing PMI: expected to decline to 47.6 from 48.9.
14:00: U.S. – FOMC Meeting Minutes
Friday
3:55: Germany – Unemployment Change: seen to leap to 5K from -16K.
4:30: UK – Construction PMI: expected to climb to 45.9 from 45.3, still in contraction territory.
10:00: U.S. – ISM Manufacturing PMI: expected to rise to 49.0 from 48.1, still in contraction mode.
