- Trade fears escalate, pressuring U.S. major indices
- U.S. listed Chinese assets take a hit
- Saudi oil could be vulnerable to additional attacks
We expect risk assets and indices—including the S&P 500, Dow, NASDAQ and Russell 2000—to be under considerable pressure this coming week, with markets likely to whipsaw on any unexpected news of a trade tiff escalation. The only thing that might quash those fears: an unequivocal statement from the White House indicating that there's been positive movement toward a U.S.-Sino trade war settlement ahead of scheduled talks later this month.
On Friday, U.S. stocks extended their decline to a three week low after news reports surfaced that the Trump administration was considering blocking all U.S. investment in China, which would include Chinese shares listed on U.S. indices. U.S. markets were already pressured by domestic political instability after the Democrat-led House launched an impeachment inquery into U.S. President Donald Trump.
On the economic data front the news wasn't good either. The American economy slowed in August as consumer spending disappointed and businesse reduced capital equipment orders, building on the economic slowdown story. However, the potential silver lining of such a scenario is that the Fed may return to earlier dovishness, which has proven more effective for market rallies than actual growth.
S&P 500 Drops On Potential Economic Disruption
The S&P 500 dropped 0.5% after the news was released. That's no surprise—If Chinese shares trading on U.S. indices were forced to delist, the possibility of economic distruption could be catastrophic. “It would be an unmitigated disaster,” said Stephen Roach, a senior fellow at Yale University who is also a former chairman of Morgan Stanley Asia.
Indeed, the damage would also go well beyond the hundreds of billions of dollars in trade tariffs the U.S and China have already levied on each other. Still, just a day after the U.S. indicated it will 'play nice' with China on trade, to then consider hitting them with a severe investment limit should have provoked a stronger response from investors, who notoriously hate uncertainty.
The S&P 500 dropped 0.53% to end the week 1.01% lower, trimming its monthly gain to 1.21%, limiting the third quarter’s advance to just 0.68%. Monday's trade, on the final day of Q3, may diminsh those gains even more deeply as September comes to a close.
The news hammered U.S. listed shares of China-based companies; internet giant Alibaba Group Holdings Ltd ADR (NYSE:BABA) took the brunt of the pain, plunging 5.15%
Technology shares (-1.34%) and Communication Services stocks (-1.06%) took the biggest hit on Friday. Financials (+0.39%) were the only sector in green, as they would be the immediate beneficiary of repatriation of U.S. investments in China.
For the week, the Health Care (-2.9%), Communication Services (-2.8%) and Energy (-2.69%) sectors underperformed. Defensive sectors Consumer Staples (+1.33%), Utilities (+1.3%) and Real Estate (+0.43%) were in the green.
On a monthly basis, all sectors were in the green with at least a 1% gain, except for Healthcare (+0.19%). Financials outperformed, (+7.18%), benefiting from a less dovish Fed; Energy (+6.77%) rallied on a quicker-than-expected Saudi recovery to an attack on the Kingdom’s oil facilities.
Finally, for the quarter, which ends Monday, the S&P 500 gained just 1.26%. Perhaps more important to note, however is the sector leadership during the period: defensive shares, Utilities (+8.29%), Real Estate (+7.2%) and Consumer Staples (+5.18%). Energy (-5.32%) led the losses, followed by Health Care (-3.25%) and Materials (-0.52%).
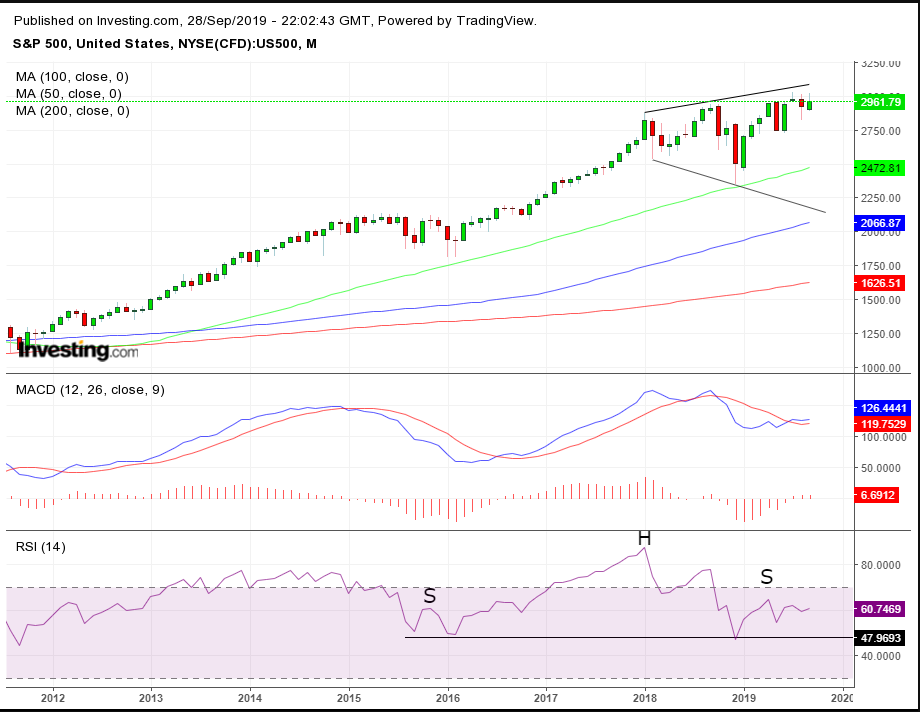
From a technical perspective, the SPX demonstrated resistance after falling below the uptrend line since the December bottom, currently for the second time since the August cluster, demonstrating enduring weakness. Both the MACD and RSI provided sell signals.
We have repeatedly discussed the broadening pattern since January 2018 and its tendency to appear at market tops. The RSI has been developing a H&S pattern since 2015. As a momentum indicator, it is potentially giving a heads up for a long-term top.
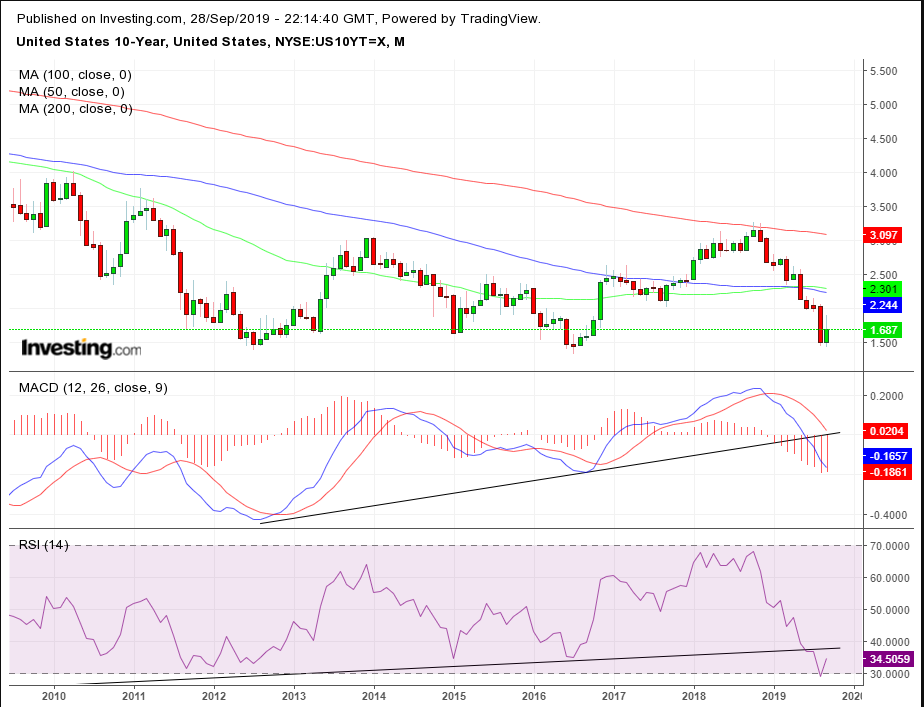
Yields on the 10-year Treasury note fell for the second day and the second week, erasing half of their monthly advances, as both the monthly RSI and MACD fell below multi-year uptrend lines.
The dollar climbed for a second week and a third month, closing just 0.02% from its highest point since May 2017.
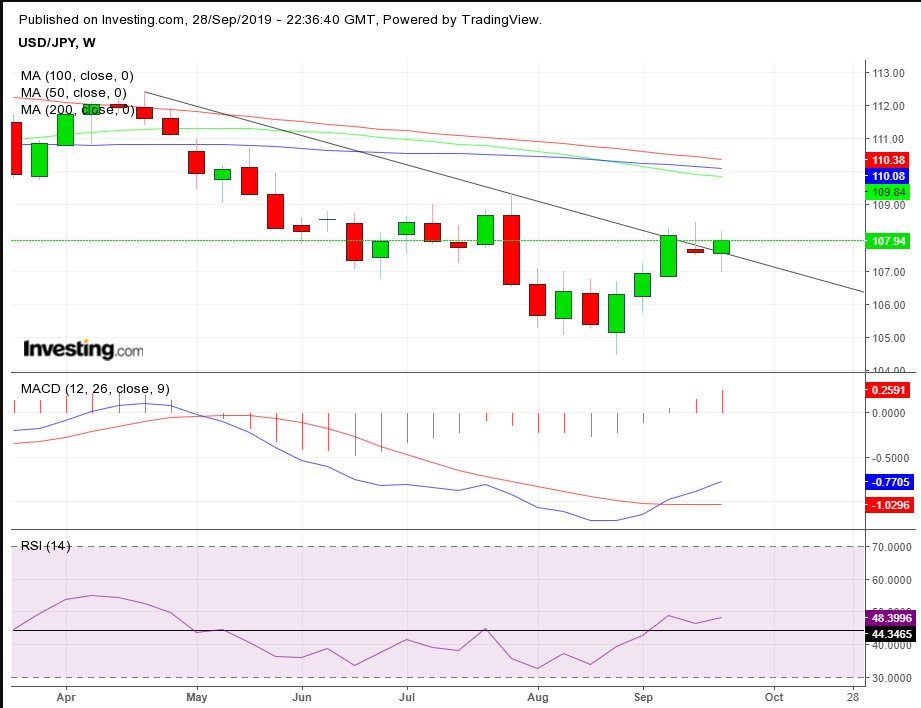
The dollar even climbed against the yen, amid risk-off sentiment, which may suggest higher foreign demand for Treasurys. Technically, the dollar-yen pair closed above a downtrend line since April, with the MACD and RSI indicating a continued climb, while last week’s shooting star offers resistance.
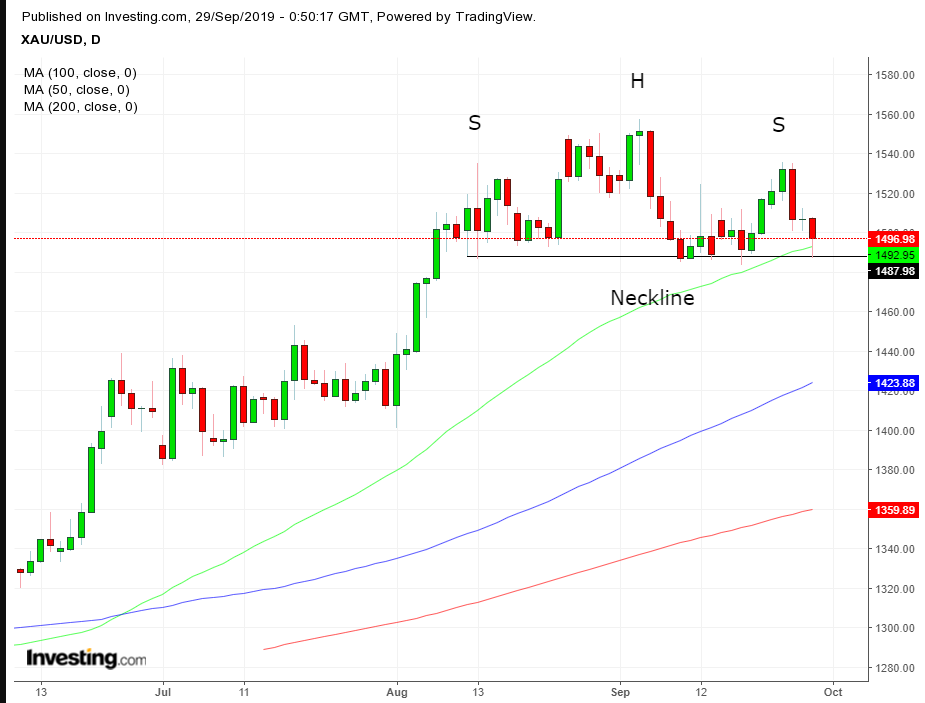
Gold fell on Friday, but closed well off its lows after finding support by the $1,487 level since Aug. 12. If broken, this would become the neckline of a H&S top. Both RSI and MACD are bearish.
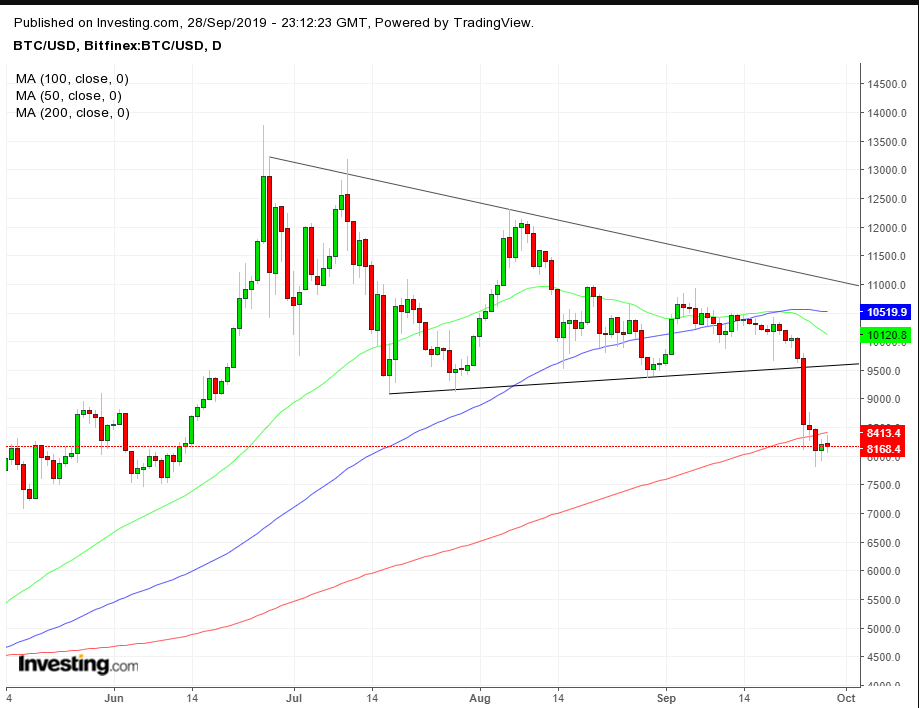
Bitcoin slipped from a rebound after reaching the bottom of the 200 DMA, strengthening the case for a top.
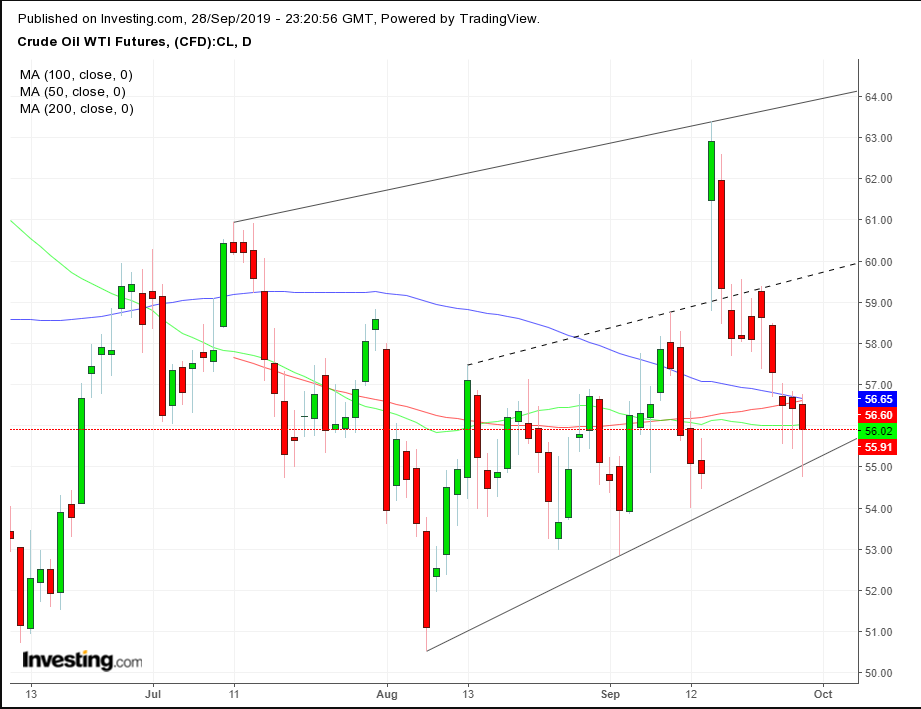
Oil fell for the fourth day as Saudi Arabia moved quickly to bring the Kingdom’s oil facilities back online amid fears of renewed attacks.
Technically, the price of WTI has been bouncing off its low for three straight days, above the bottom of a rising channel since July. Prices have been fluctuating between the 200 DMA and 50 DMA after the two have been intertwining throughout the emergence of the pattern, denoting the potential for an explosive move.
Week Ahead
All times listed are EDT
Sunday
21:00: China – Manufacturing PMI: expected to remain flat at 49.5.
21:45: China– Caixin Manufacturing PMI: likely to edge down to 50.2 from 50.4.
Monday
3:55: Germany – Unemployment Change: seen to rise to 5K from 4K.
4:30: UK – GDP: forecast to remain steady at -0.2% QoQ and 1.2% YoY.
19:50: Japan – Tankan Large Non-Manufacturing Index: seen to come in at 20 for the third quarter, from 23.
Tuesday
00:30: Australia – RBA Interest Rate Decision: expected to cut to 0.75% from 1.00%; this will be followed by an RBA Rate Statement.
3:55: Germany – Manufacturing PMI: expected to be flat at 41.4.
4:30: UK – Manufacturing PMI: likely fell to 47.0 from 47.4
5:00: Eurozone – CPI: expected to come in flat at 1.00% YoY.
8:30: Canada – GDP: probably edged down to 0.1% from 0.2% MoM
10:00: U.S. – ISM Manufacturing PMI: seen to rise to 50.1 from 49.1.
Wednesday
4:30: UK – Construction PMI: expected to go fall to 44.9, deeper into contraction territory, from 45.0.
8:15: U.S. – ADP Nonfarm Employment Change: forecast to plunge to 140K from 195K.
10:30: U.S. – Crude Oil Inventories: Last read was 2.412 million barrels.
Friday
8:30: U.S. – Nonfarm Payrolls: September reading expected to increase to 145K from 130K in August.
