- Value sectors outperformed throughout the week
- Yields near yearly highs, now competing with both stocks and gold
- Bitcoin reaches more than $1 trillion in market valuation
- Oil slips below $60 as refineries begin to come back online
Treasury yields touched their highest point since February 2020 on Friday and US stocks finished the trading week mixed as investors indicated they're questioning the implications of inflation on equities and gold. That sentiment will likely continue into the new trading week.
Oil slipped below $60 a barrel at the close of the trading week, as US production started to come back online.
Risk-Tolerance Increasing; Treasurys Sold-Off
The S&P 500 Index was the only major US benchmark that closed in the red, (-0.2%) on Friday. Traders are beginning to worry that rising yields could provide competition to stocks. With near-zero interest rates in force over the past year, providing no return, some of the recent demand for stocks has been coming from traditional bond investors. Even conservative equity investors were forced to increase their exposure to risk as the US stock market kept escalating in value.
Now, with rising yields, the chances the Fed will begin lowering its asset purchases, reducing liquidity, are starting to increase. This Fed easing initiative has been fueling stocks past what some—including us—believe are rational levels.
Four sectors outperformed on Friday: Materials, (+1.8%), Energy, (+1.7%), Industrials (+1.6%) and Financials (+1.2%), painting a clear picture of the reflation trade, in which value stocks that lagged throughout lockdowns are now regaining their appeal. The same four were also the only sectors in the green on a weekly basis, with Energy (+3.4%) in the lead, followed by Financials (+2.8%), with Materials (+1%) and Industrials (+0.75%) coming in lower.
As well, ahead of the weekend, while the NASDAQ Composite added just 0.07% of value, the small cap Russell 2000—whose listed domestic firms were boosted by the reflation trade—surged 2.05%.
Though all four major US indices posted record highs last week, with the exception of the Dow Jones Industrial Average, they all closed lower. Technically, even the Dow's weekly trading produced a high wave candle, connoting confusion and fear, a state of investor psychology that makes the situation ripe for a pullback.
The NASDAQ Composite looks even worse.
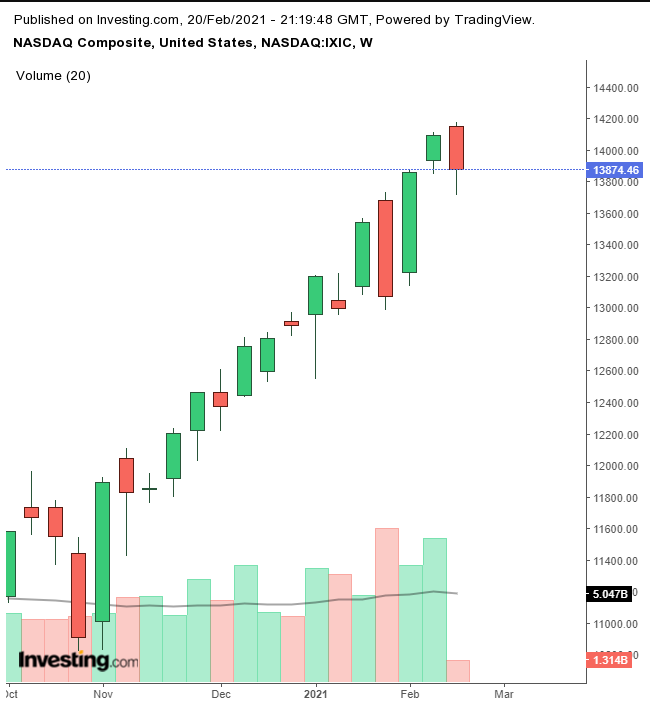
The tech-heavy index opened higher but closed lower than the previous week’s real body—the price range between open and close—forming a Dark Cloud Cover: the bears put down their cards, but the bulls had the better hand. The silver lining is that the long, red candle was on low volume, suggesting the selloff wasn’t driven with wide participation and therefore doesn’t represent the trend.
Fresh stock market records came as ongoing negotiations for another stimulus package by legislators in Washington kept the possibility of more fiscal aid in the news cycle, compounding the overall optimism already being driven by the ongoing vaccine rollout and economic data that dipicts an economy with some rough spots, but still able to withstand the pandemic and is prepared for growth once economies reopen.
Retail sales last week showed 5.3% growth in consumer spending in January on a MoM basis, the strongest figure since the fall and almost triple the growth of the two previous months. This surge in spending is probably a combination of easy-money from earlier government stimulus and relief-spending by consumers after being constrained by lockdowns. (Renewed lockdowns in some regions during February will be reflected in the next release).
This data is important for two reasons: First, consumer spending is responsible for a whopping 70% of economic transactions, which—in a Keynesian economy—is how we measure economic output; and second, it helps understand the current spike in yields, which are responding to expectations of rising inflation, as investors dump current notes to free up cash for upcoming issues with what they expect will be higher yields.
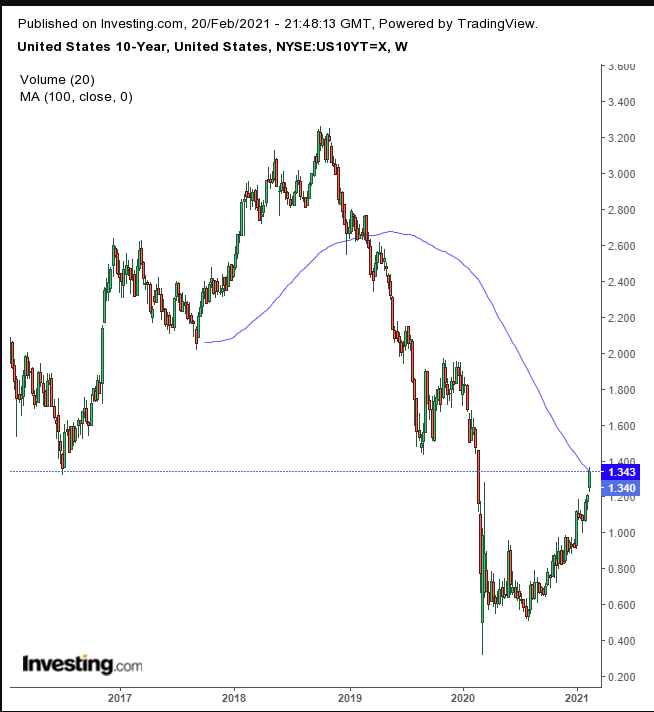
Yields, including for the 10-year benchmark note, advanced for the third straight week, surging 13 basis points, the biggest weekly gain in six weeks. Rates closed at the highest level since Feb. 25, 2020. Yields were even higher but were pressured lower by the 100 WMA and the July 2016 trough.
The dollar slumped on Friday for a second day, despite rising yields over the same period. The two tend to have a positive correlation, which seems to have broken down.
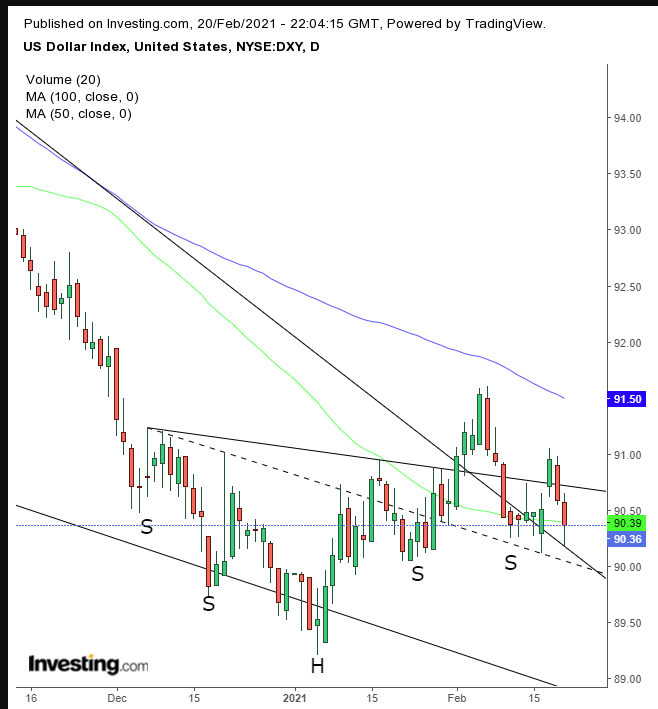
The dollar has been trapped between the 100 and 50 DMA, as the price struggles to find direction. The greenback completed a H&S bottom but fell back below the neckline. Note, the price is wobbling between our interpretation of the neckline (solid trendline) and an alternative trendline (dotted line). For now, however, the price seems to have found support above the falling wedge since the March top.
A two-day dollar selloff wasn’t enough to boost gold, and reverse it back into a rally.
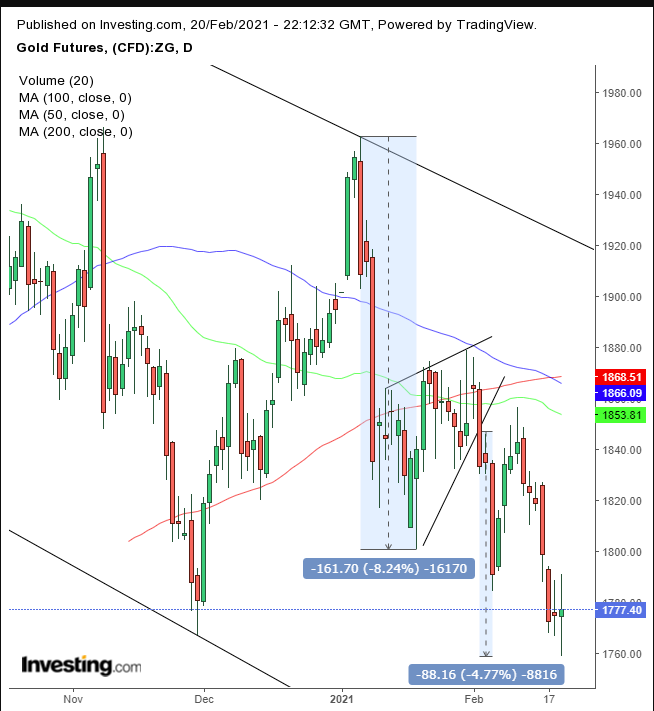
Rather, the yellow metal edged higher, weakly. Note the two repeated high wave candles, showing traders were pulled in both directions: weak dollar boosting gold, while raising yields siphoned away investors from one safe haven asset to another, which acted as a headwind. The precious metal registered a trough lower than the previous one posted on Nov. 30. However, the higher close may signal a rebound.
However, consider that the price action is taking place within a falling channel, and what’s more, the 100 DMA dipped below the 200 DMA, completing a bearish MA formation, in which each shorter moving average is below longer counterparts. Finally, the last piece of the puzzle in our bearish view is that the price achieved just over half of the implied target of the rising flag that developed in January.
Bitcoin, it appears, is on an accelerating, one-way trajectory to the moon.
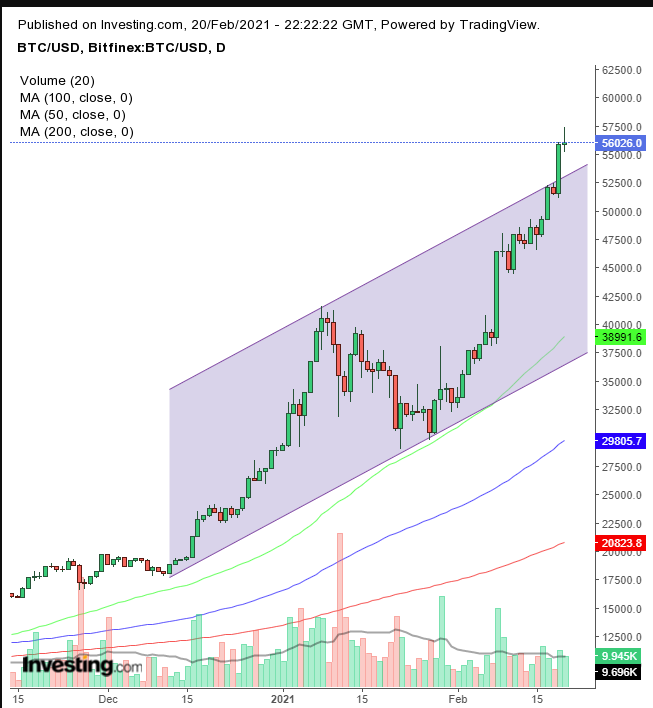
On Feb. 17 we cautioned that the cryptocurrency seemed primed for a pullback, but investors just kept bidding it up. At that time the price was $51,555. It's now trading just over $56,000.
After the price dipped below today's high of $57,532, the candle that's developing is a doji, a sign of a potential reversal, as the rally loses steam. But how many times can we repeat the same thing? Still, volume has been diminishing, which demonstrates thinning participation in the rally.
After the digital token's 100% surge since just the start of the new year, even enthusiast Elon Musk, founder and CEO of Tesla admitted, as reported yesterday—perhaps apologetically—that the price of the cryptocurrency, which now has a market cap of $1T “seems high.”
WTI dropped back below $60 on Friday, as oil refineries in Texas began resuming production operations. Still, it may take weeks for production to recover. Over the longer haul, analysts at JPMorgan expect an improving global economy as well as OPEC+’s continued lid on production will help boost oil prices by an additional $10 or so a barrell going forward.
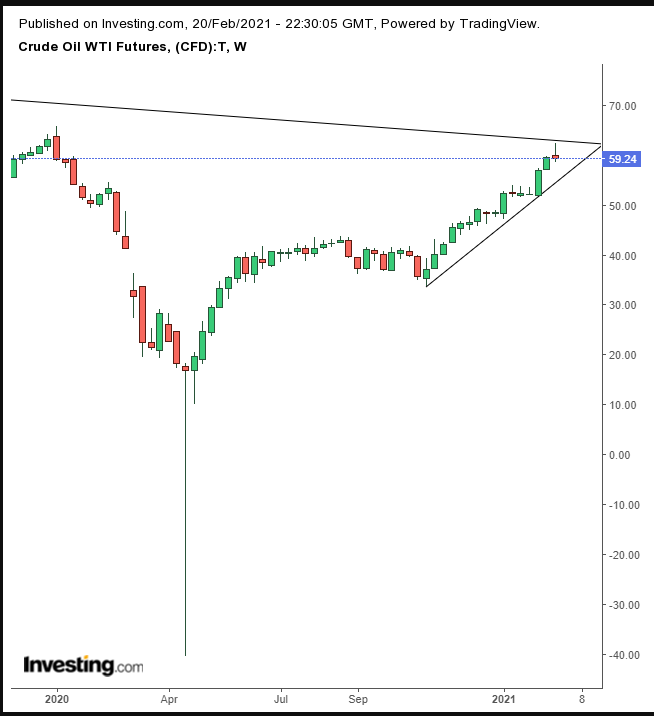
Oil found resistance by the falling trend line since the 2008 peak, forcing the price to develop a shooting star, a bearish pattern that projects an attempted bearish advance was thwarted by stronger bulls. The bearish candle below the super-long downtrend line is significant.
The Week Ahead
All times listed are EST
Sunday
20:30: China – PBoC Loan Prime Rate: previous reading was 3.85%.
Monday
4:00: Germany – Ifo Business Climate Index: expected to edge higher to 90.5 from 90.1.
Tuesday
2:00: UK – Claimant Count Change: probably surged to 35.0K from 7.0K.
5:00: Eurozone – CPI: seen to remain steady at 0.9% YoY.
10:00: US – CB Consumer Confidence: anticipated to edge higher, to 90.0 from 89.3.
10:00: US – Fed Chair Powell Testifies: the central bank president presents the semi-annual, Monetary Policy Report to Congress.
20:00: New Zealand – RBNZ Interest Rate Decision: likely to remain steady at 0.25%.
Wednesday
2:00: Germany – GDP: expected to remain flat at 0.1% QoQ.
10:00: US – New Home Sales: predicted to have climbed to 855K from 842K.
10:30: US – Crude Oil Inventories: estimated to leap to -2.429M from -7.258M.
Thursday
8:30: US – Core Durable Goods Orders: anticipated to drop to 0.7% from 1.1%.
8:30: US – GDP: forecast to inch higher, to 4.1% from 4.0%.
8:30: US – Initial Jobless Claims: predicted to come in at 843K from 861K.
10:00: US – Pending Home Sales: likely to rise to -0.1% from -0.3%.
Friday
8:30: US – Personal Spending: expected to jump to 2.5% from -0.2%.
Saturday
20:00: China – Manufacturing PMI: seen to climb to 51.6 from 51.3.
