- Though stock markets still anticipate additional fiscal aid, any continued delay could fuel a take-profit selloff
- News likely to cause ongoing whipsaws
Contradictory signals regarding the possibility of additional fiscal stimulus from the US government fueled equity volatility this past week, and will likely have a continued unsettling effect on markets in the week ahead. Still, on Friday, American stocks sealed their biggest week in three months, on speculation the on-again, off-again stimulus will become a reality.
In a mirror image, Treasuries fell to their lowest level over the same period. The dollar fell and gold surged.
White House Flip-Flops On Aid But Investors Remain Bullish
The S&P 500 Index climbed on Friday for a third consecutive day, to register its biggest weekly advance since early July. Oddly, the move was triggered by US President Donald Trump saying he wanted an even bigger stimulus package than the $2.2 trillion that House Democrats had been holding out for.
It was yet another flip-flop from the president who earlier in the week had put a halt to ongoing negotiations between House Speaker Nancy Pelosi and Treasury Secretary Steven Mnuchin on coronavirus aid, a move that undercut his own negotiators. But the Trump administration then waffled again.
On Saturday, White House communications director Alyssa Farah said the administration "wanted to keep spending below $2 trillion but was eager to enact a fresh round of direct payments to individuals as well as aid for small businesses and airlines." Apparently, Mnuchin had floated an offer of $1.8 billion during a brief phone conversation with Pelosi on Friday.
What perplexes us most about all this aren't the impulsive and contradictory actions of the administration. Rather, it's that investors keep buying into this rhetoric.
We would have expected stocks to sell off when investors realized that they couldn't count on the words of the president. Nevertheless, all four major US indexes finished the past week by clocking their best weekly results in months.
The S&P 500 jumped 4.3% for the week, the most for the broad benchmark since the week of July 2 when it registered a 4.9% gain. The Dow Jones Industrial Average added 3.25%, the most for the 30-component mega cap index since the 3.8% posted during the week starting Aug. 3. The NASDAQ Composite gained 4.6%, its biggest return on a weekly basis since the week starting Aug. 24, when the tech-heavy index posted a 5.5% gain.
Finally, the Russell 2000 outperformed, jumping 6.4%, its biggest advance since the week of June 1, when the small cap, domestically-focused index gained 8.1%.
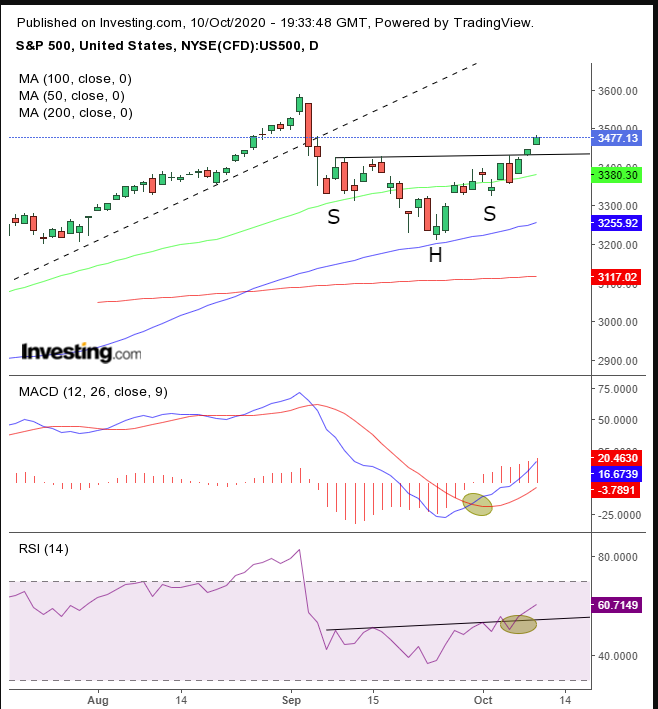
The SPX, as well as the Dow and NASDAQ, completed H&S bottoms, suggesting they will all be retesting records. The S&P is just a tad more than 3% below its all-time high. The Dow is just 1.8% from its Sept. 2 record high, putting it in position to potentially be the first to retest that record.
After the recent tech stock rout, the NASDAQ is 4.1% from its own record level, making it the furthest away, but still relatively near considering its recent sharp selloffs. The Russell 2000 is 4.1% from its Jan. 16 record close.
Since March, stock market bulls have produced a powerful rebound, including the best market performance in decades, encouraged by a vigorous economic recovery that's included some record data. Similarly, after the almost 32% GDP plunge during the second quarter—the worst on record—economists are now expecting a record jump for the third quarter, the result of a partially open economy coupled with the release of pent-up household demand.
However, keep in mind one pivotal factor—this demand was supported by the unprecedented monitory and fiscal policies of the Fed and US government, which included a guarantee of low interest rates for longer than many originally anticipated, as well as aid checks to households, expanded unemployment benefits and Paycheck Protection Program loans. Indeed, it was this initial stimulus that boosted everything: the economic rebound after the pandemic-triggered recession that was the worst since last century's Great Depression; the SPX's 20.5% Q2 gain for its best quarterly return since 1998 and the more than 18% rise for the Dow Jones over the same period, its best quarter since 1987.
With markets currently expecting additional stimulus, Treasury yields, including for the 10-year benchmark, rose Friday to their highest level since June 9, supported by the 200 DMA for the third straight day.
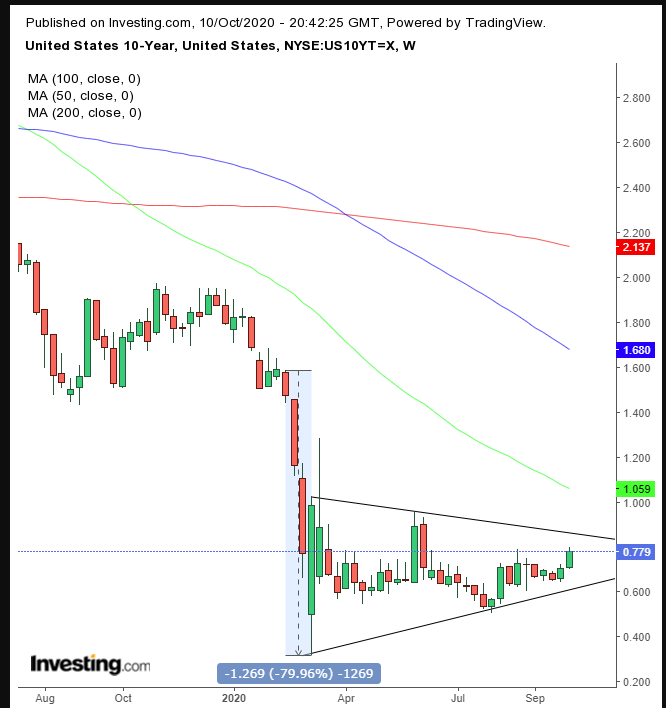
However, to allay concerns of another leg down, yields will have to break through the 1.00% level, or repeat the crash into a record low. A downside breakout of the symmetrical triangle may repeat the previous move, which would turn yields negative, similar to what occured for oil six months ago.
Similarly, more money pumped into the system reduces the dollar’s value. As well, the Treasury selloff by foreign investors includes a repatriation of the global reserve currency at the dollar’s expense.
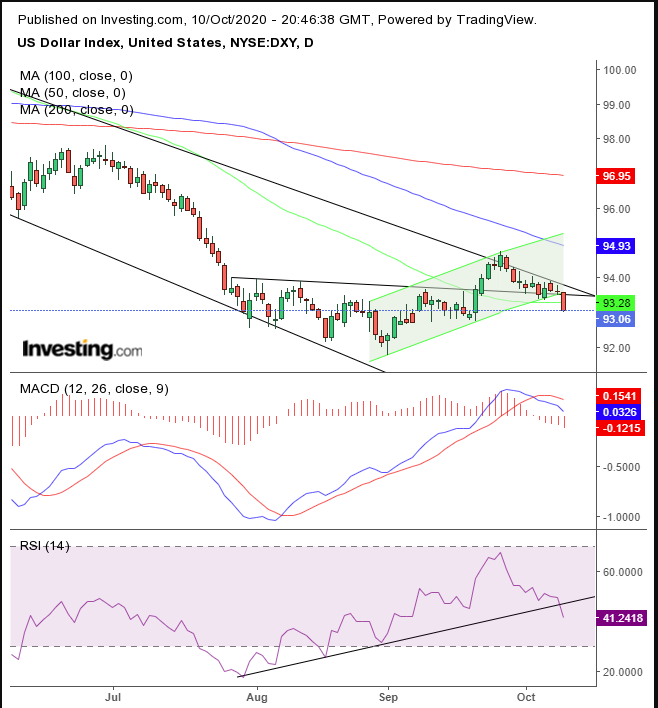
The Dollar Index appears to have blown out its H&S bottom and short-term rising channel, as it continued along its long-term falling channel since the March high.
Gold surged Friday, boosted more than 2%, to a three-week high on dollar weakness.
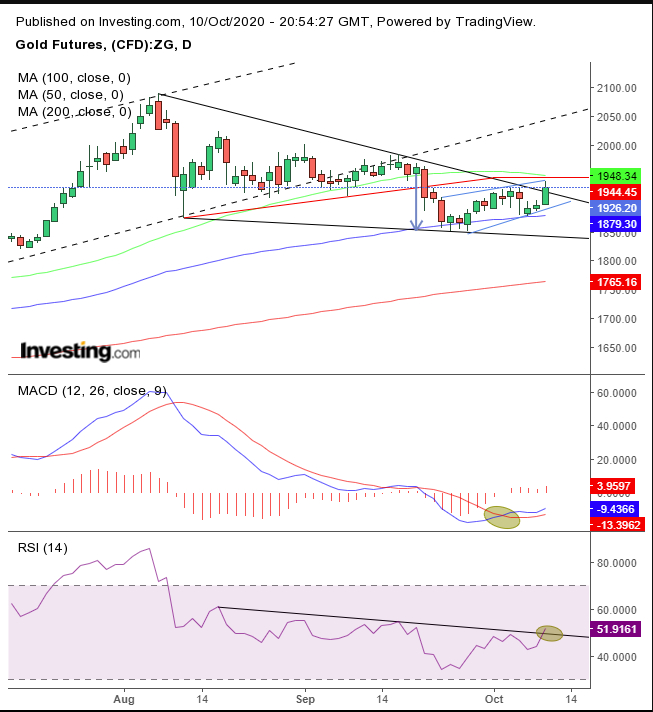
We consider the $1,950 level to be the apex of the symmetrical triangle to determine whether that bearish pattern holds, followed by a second bearish pattern, a rising flag. However, the price could blow out both bearish patterns along with a larger, bullish pattern, the rising wedge, that envelopes both bearish patterns.
Indicators are giving gold the breadth to continue higher.
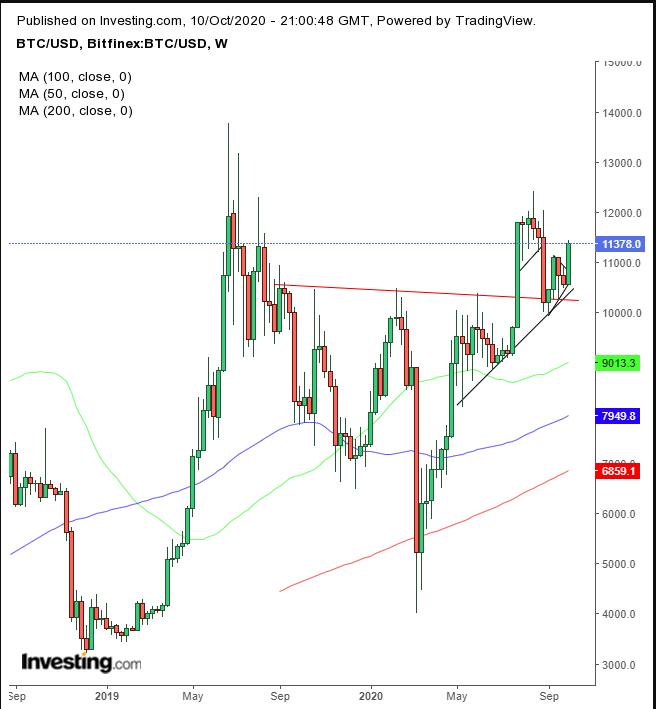
Bitcoin blew out a would-be H&S or triangle continuation pattern during September, bouncing off the neckline of a 14-month-long H&S bottom.
The price of WTI fell after Hurricane Delta weakened as the storm approached the US Gulf Coast. Still it left plenty of havoc in its wake.
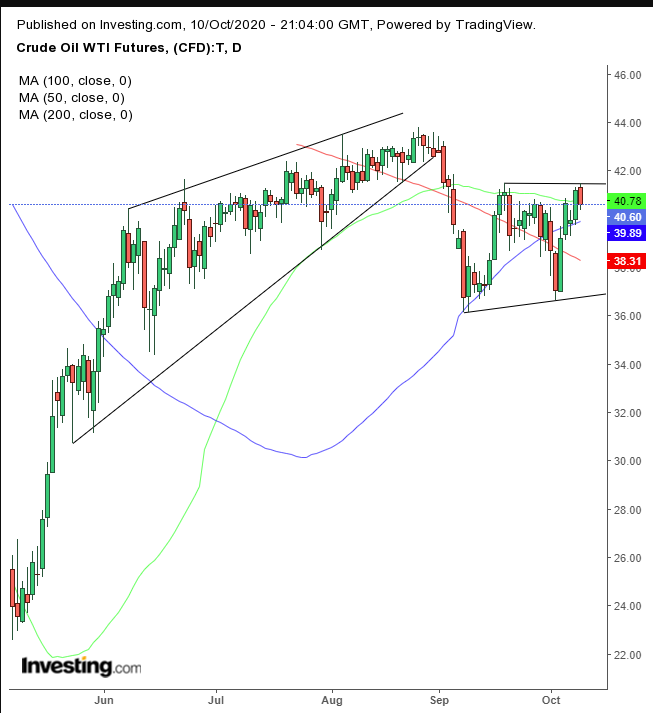
Technically, the supply since oil's Sept. 18 highs remained intact, pushing the price back below the 50 DMA, setting up a range, with a downward bias following the bearish rising wedge.
The Week Ahead
All times listed are EDT
Monday
Canadian markets closed for the Thanksgiving holiday.
Tuesday
5:00: Germany – ZEW Economic Sentiment: expected to decline to 74.0 from 77.4.
8:40: US – Core CPI: seen to drop to 0.2% MoM from 0.4%.
Wednesday
5:00: Eurozone – Industrial Production: anticipated to have slipped to 0.7% from 4.1% previously.
8:30: US – PPI: likely edged down to 0.2% in September from 0.3%.
20:30: Australia – Employment Change: forecast to have slumped to -35.0K from 111.0K.
Thursday
8:30: US – Initial Jobless Claims: printed last week at 840K.
8:30: US – Philadelphia Fed Manufacturing Index: expected to hold at 15.0.
11:00: US – Crude Oil Inventories: anticipated to plunge to 0.294M from 0.501M
Friday
5:00: Eurozone – CPI: predicted to remain flat at -0.3%.
8:30: US – Core Retail Sales: forecast to fall to 0.4% from 0.7%.
8:30: US – Retail Sales: probably held at 0.6%
