- Vaccine progress and stimulus expectations underpin bullish market narrative
- Oil, equities will keep rising
Notwithstanding Friday's weaker than expected nonfarm payrolls report, US equity indices for the Dow Jones, S&P 500, NASDAQ and Russell 2000 all finished higher on the final day of trade as well as for the week. The small-cap Russell saw its steepest boost since June; the SPX saw its best weekly performance since November. The broad benchmark also hit a new record high on Friday, for the second day in a row.
The disappointing jobs numbers for January strengthened the Democrats' resolve that $1.9 trillion relief plan was a necessary economic stimulus. While new high-water marks for stocks by definition indicate prices are the most expensive they’ve ever been, cheap money is likely to continue inflating the market bubble.
Crude oil rose to its highest level in over a year on Friday. The dollar plunged.
Wider Yield Curve, Falling Dollar
Both chambers of Congress passed a budget resolution on Friday, having cleared a Republican filibuster. It was an integral procedural step, necessary for Democrats to push through President Joseph Biden’s fiscal package.
The NFP release fell short of expectations for the second month in a row. The number of jobs created in January rose by 49,000, following a downwardly revised 227,000 December slump. After the release, the President pointedly remarked on fiscal aid: “We can’t do too much here—we can do too little.” This may be Biden’s strongest language yet suggesting he’ll ram a higher level of stimulus through, with or without the Republicans.
As we have often pointed out in the alternative equity market economy, which governments have been lubricating for over 12 years now, investors cheer bad data since it raises the odds for more Fed easing, and recently, additional lawmaker fiscal largesse.
We can expect that additional stimulus, continued accommodative Fed policies and vaccine distribution progress will buttress consumer spending, responsible for 70% of the US GDP.
The S&P 500, both the NASDAQ Composite and NASDAQ 100, and the Russell 2000, all notched new records on Friday, while the Dow Jones Industrial Average finished just 1.3% shy of its record close of Jan. 20.
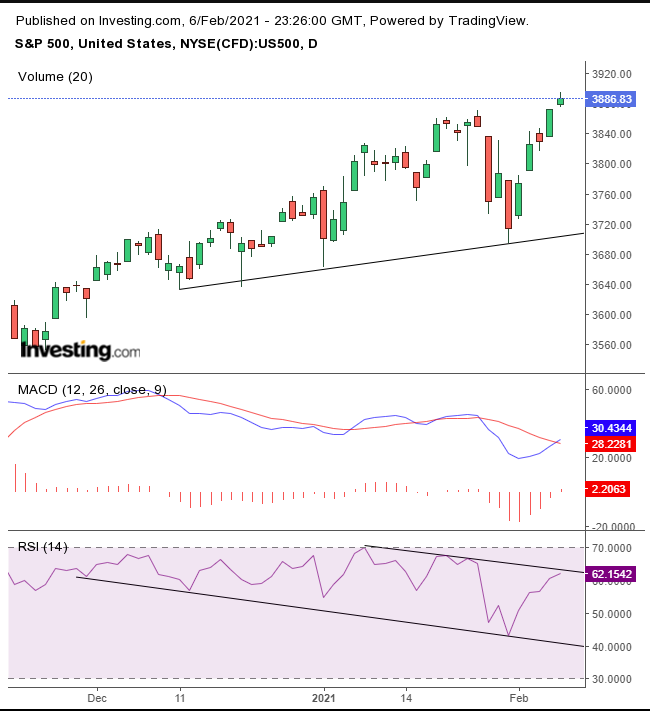
Although stocks on the SPX continue to climbed, they have done so within a very congested price range, which may be the prelude to a top. Note the negative divergence between the price verus both the RSI and the MACD.
GameStop (NYSE:GME) surged 19.2% on Friday after Robinhood eliminated its restrictions on buying the stock. Still, the move was just a drop in the bucket in dollar terms, with the stock gaining $10.37 to close at $63.77. Shares of the retailer were still down $261.23, or off 80.4% from the $325 high reached in late January.
It’s noteworthy, though, that at this point GameStop manifests a negative correlation to the broader market. The vociferous speculation, as retail investors egged each other on via Reddit to keep assuming risk, triggered concerns of a market top. Now that the frenzy has muted, investors have once again regained their composure, and more rational positioning along with it.
Pinterest (NYSE:PINS) jumped 5.3%, hitting a new record, as the digital scrapbooking and communications company beat sales expectations. However, the stock pared gains by half from an initial 10.9% surge.
Peloton Interactive (NASDAQ:PTON), which manufactures interactive fitness equipment, plunged 5.9% after announcing it was experiencing supply chain issues and won't be able to keep up with demand for its exercise machines, warning that profits, which beat expectations during its Q4 2020, will decline.
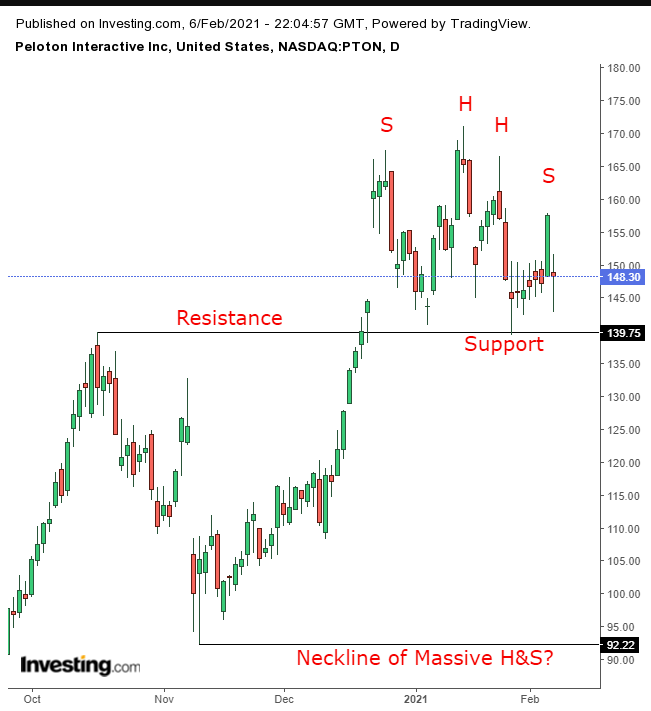
PTON is forming a H&S top. What's most interesting, however, is that it’s perfectly aligning with the Oct. 16 high. The price action demonstrates how investor psychology, momentum and market mechanics can flip. If the H&S completes, and prices fall, it may prove to be the head of a massive H&S, starting with the Oct. 16 high
While the most popular yield curve measure is the spread between the 2-year and 10-year Treasury yields—which is the widest since 2017—last week, the gap between the 5-year note and the 30-year bond reached its widest spread since 2015.
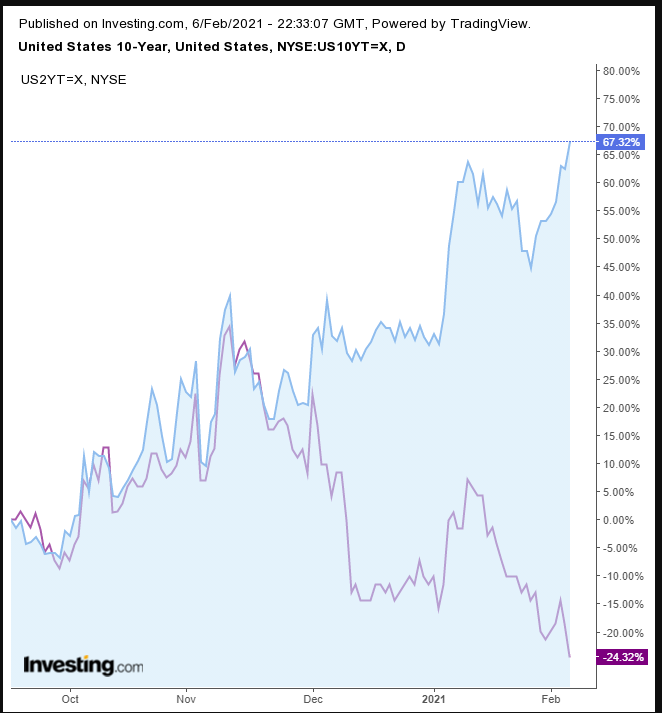
The yield curve steepens when investors believe the economic outlook will strengthen over time, and along with it, inflation will rise, prompting the Fed to raise interest rates, which in turn provides a larger payout for bond holders. Therefore, rather than get locked into long-term bonds now, investors are parking their money in short-dated Treasuries, till new long-bond issues are released with higher rates.
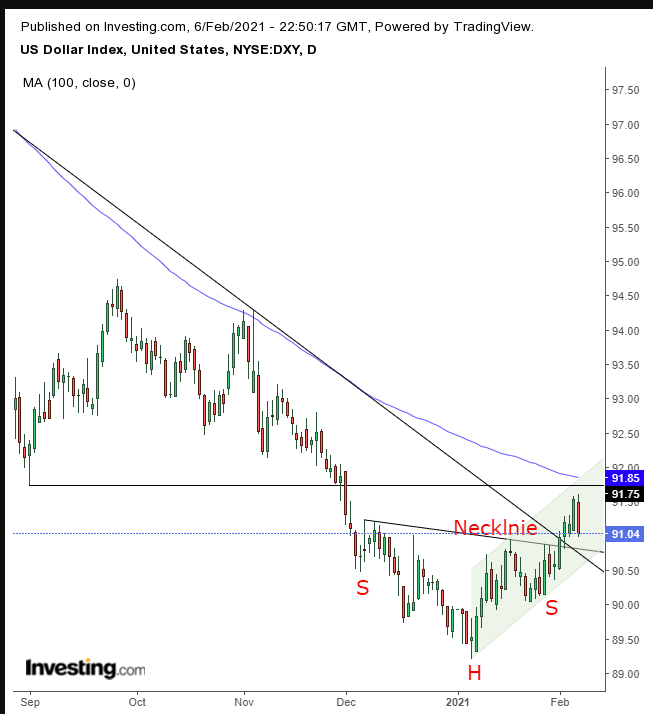
The dollar took a hit Friday, falling more 0.5%, the worst drop for the global reserve currency since Dec. 17.
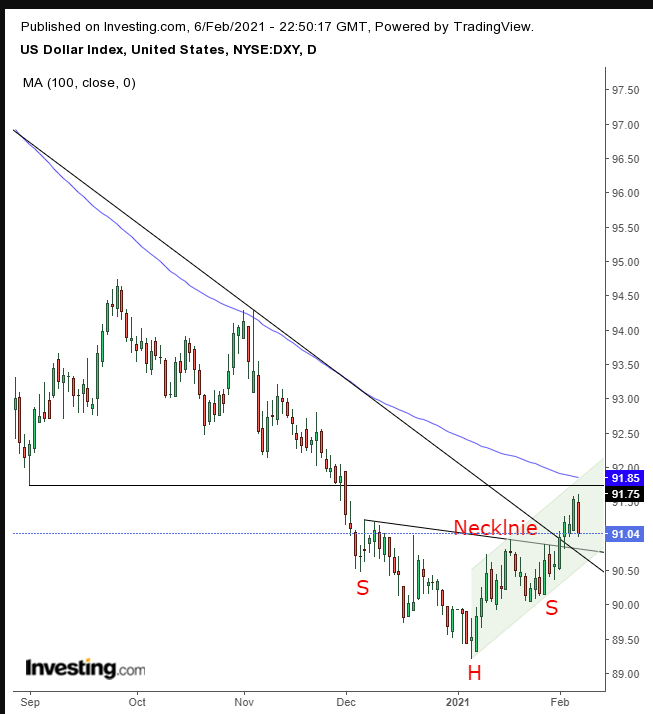
The greenback fell on profit-taking, as part of a return-move, which follows a breakout. What better time for lucky bulls to cash out than when coming up to the expected pockets of supply that would be waiting by the June 1 support, now an expected resistance, underscored by the 100 DMA?
If our analysis last week was right, the nexus, where the H&S bottom meets the falling trendline since the March high will probably hold, and the dollar will likely rebound past the 92.00 level. To be clear, the medium-trend on the USD is still down, until the price posts rising peaks and troughs on the weekly level, which would push the Dollar Index over 95.00.
The dollar's drop on Friday boosted gold, but it may be too little, too late for the yellow metal.
On Thursday, the precious metal fell below the Jan. 19 flag low, adding confirmation to the pattern’s bearish tilt, especially amid a falling channel. It found resistance by the 200 DMA, amid a Death Cross to boot. Also, the MACD extended its bearish cross. All this doesn’t build a great case for the H&S bottom, which could still turn out to be a double bottom, but the technicals are stacked against that.
Bitcoin surged 16.6% for the week, to trade back above $40,000, for its best weekly performance in four, closing a mere 1.1% from its Jan. 8 record. At time of writing, however, the digital currency has moved below that psychological level. As opposed to previous rallies by the digital token, however, which were driven by retail investors, this time BTC is getting help from institutions. After the recent GameStop fiasco, it seems retail traders and Wall Street have found something they can agree on.
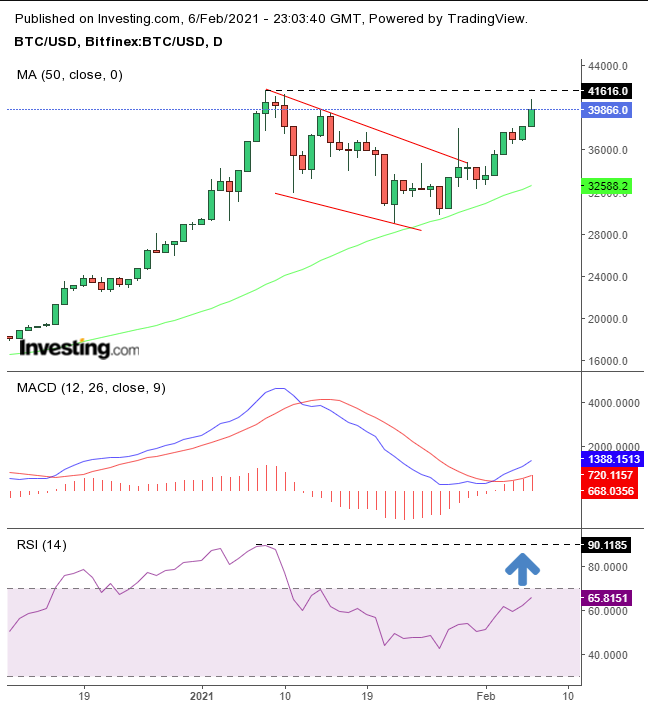
We believe Bitcoin is heading toward $50,000. The MACD just entered a bullish cross, and the RSI shows there’s plenty of upside for momentum before the risk of it getting overheated.
Oil climbed on Friday, rising 1.5%, gaining 8.9% over the course of the week. It was the strongest weekly rally for the commodity since October, and a high for the year on expectations that additional stimulus, a peak in the number of coronavirus cases and progress in vaccinations would increase demand even as OPEC+ cuts supply.
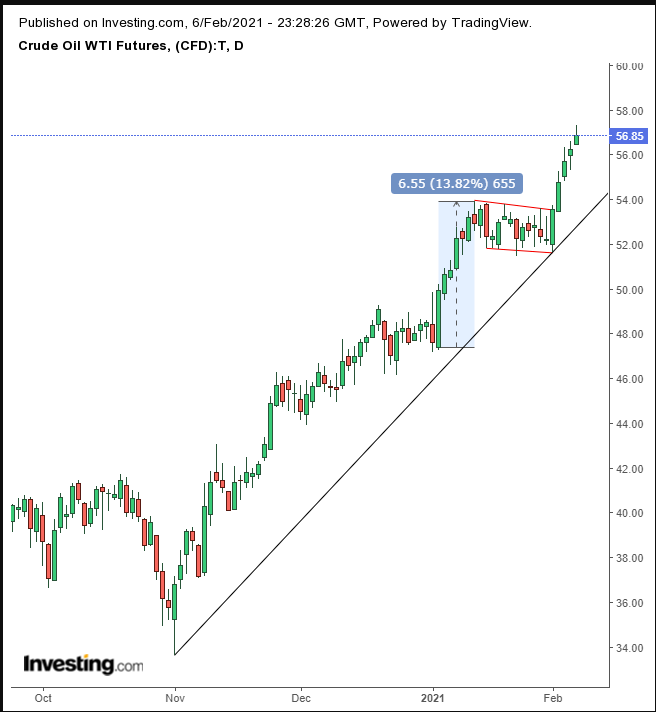
The price broke out of a bullish flag, targeting the $60 level.
Much like US equities, oil moved higher every day last week. Both are operating within the same expectation—the return of a normal economy. However, with unfathomable amounts of QE and accommodative fiscal policy, it won't really be a normal economy, even if ultimately it does resemble one. Neither investors, nor pundits, nor economists—nor anyone else—knows what will happen when all the fiscal easing finally starts coming to an end.
The Week Ahead
All times listed are EST
Tuesday
7:00: US – EIA Short-Term Energy Outlook
10:00: US – JOLTs Job Openings: expected to drop to 6.400M from 6.52M.
Wednesday
8:30: US – Core CPI: seen to rise to 0.2% from 0.1%.
10:30: US – Crude Oil Inventories: anticipated to drop to -2.808M from -0.994M.
Thursday
7:00: US – OPEC Monthly Report
8:30: US – Initial Jobless Claims: likely dropped to 750K from 779K.
11:00: US – Fed Monetary Policy Report
Friday
2:00: UK – GDP: expected to edge higher, to -8.1% from -8.5% YoY and plunge to 0.5% from 16.0% QoQ.
2:00: UK – Manufacturing Production: to remain flat at 0.7%.
5:30: Russia – Interest Rate Decision: forecast to remain steady at 4.25%.
Which stock should you buy in your very next trade?
With valuations skyrocketing in 2024, many investors are uneasy putting more money into stocks. Unsure where to invest next? Get access to our proven portfolios and discover high-potential opportunities.
In 2024 alone, ProPicks AI identified 2 stocks that surged over 150%, 4 additional stocks that leaped over 30%, and 3 more that climbed over 25%. That's an impressive track record.
With portfolios tailored for Dow stocks, S&P stocks, Tech stocks, and Mid Cap stocks, you can explore various wealth-building strategies.


