- Equities to remain in a bear market and in a downtrend
- Gold could slip further
Though U.S. equities surged on Friday—their biggest one day jump since 2008—as markets finished a highly volatile roller coaster of a week driven by coronavirus developments, we expect stocks to resume their downtrend during the week ahead.
The move higher for the Dow, S&P 500, NASDAQ and Russell 2000 was triggered by Friday afternoon's letter to lawmakers from House Speaker Nancy Pelosi announcing that after days of intense negotiations with Treasury Secretary Steven Mnuchin, a deal had been reached to provide expanded access to free testing, $1-billion in food aid and paid sick leave to many of those affected by the pandemic. The legislation was passed overwhelmingly in the House early Saturday morning.
During the course of the preceding week, in which markets were buffeted between significant losses one day followed by smaller rallies the following day, until Friday's surge, investors, analysts and even casual observers watched in bewilderment as Covid-19 rapidly spread across the globe, causing equities to dive into a bear market. It was the worst week for financial markets since the crash of 2008.
As well, oil sold off in a single day at the start of the past week, the biggest drop for the commodity in nearly three decades.
Central banks rushed in to try and calm the stampede out of risk assets, even as countries outside of Asia joined in the population lockdown, keeping work forces and schoolchildren home while sometimes closing non-essential business, in an effort to slow the viral spread.
Stopgap Measures But No Real Solution
The longest bull market on record didn’t die quietly. Traders were whipsawed throughout the week. Panic-driven selloffs triggered market circuit breakers, temporarily halting trade twice, first on Monday, then on Thursday, something that hasn't happened since 1997. The Dow fell by 7% on both days.
While these safety features may momentarily arrest a market meltdown, they can't actually stop it from occurring. Indeed, the measure might not only prolong the inevitable but hasten it, as news of tripped circuit breakers only increases the panic.
Treasurys needed a stopgap of sorts as well, to allay concerns driving another type of vicious cycle. The 'circuit breaker' this time was the Federal Reserve, which injected $1.5 trillion dollars in available reserves to sooth investor angst reflected in bond yields that have been regularly carving out unprecedented lows.
After news of the coronavirus aid deal broke, traders rushed back into risk, madly buying equities. The SPX leaped more than 9% on Friday, trimming Thursday’s 9.10% losses to just -1.10% for the week.
Though the administration's aid package may give stocks another furious daily boost as the trading week begins, has anything fundamentally changed? Has the global pandemic slowed? Is there suddenly a cure available, or even a vaccine? Nope.
Which means, unfortunately—even ignoring for the moment the human cost of this disease—focusing strictly on the economic impact, throwing money at the coronavirus problem via an aid package, no matter how well intentioned from a humanitarian perspective, does not necessarily mean that businesses, their manufacturing lines and supply chains, will be able to function efficiently. Ultimately, without preventive medications or a complete cure, markets could continue to see a downward spiral for companies: lower profits, fewer jobs, lower consumer spending followed by even lower profits.
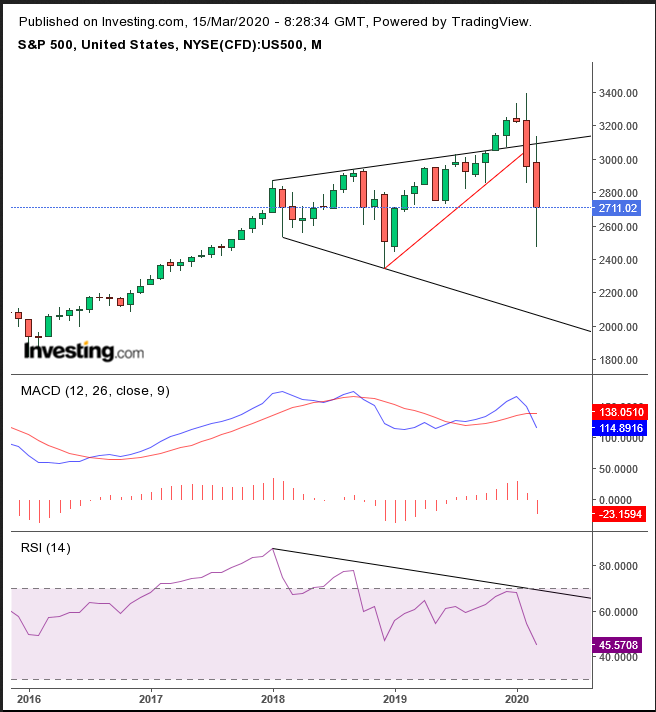
From a technical standpoint, we consider this return move within a downtrend to be another shorting opportunity. We've also been keeping an eye on the S&P's long-term broadening pattern, generally found at market tops.
On the Dow's monthly chart, it's clear how far the bottom extends.
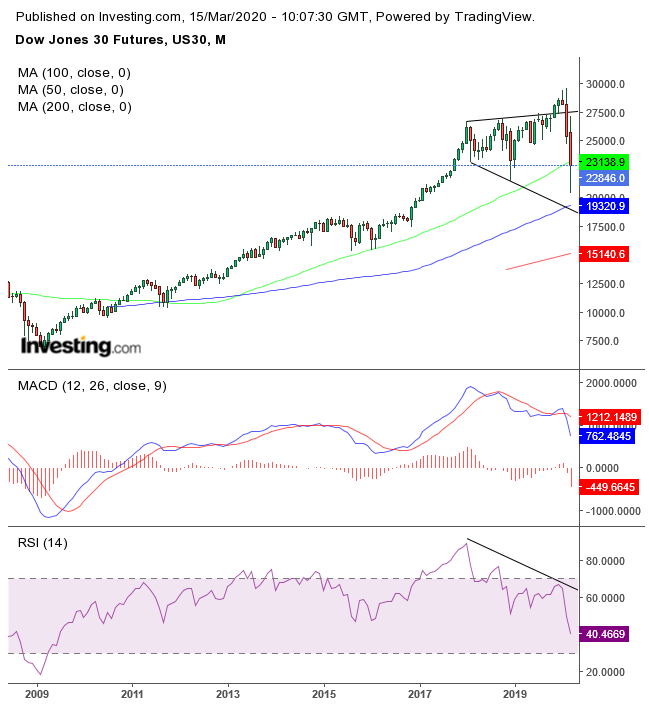
A downside breakout of this imprecise pattern (since trendlines keep getting further away) would signal a market top. A top means there's no more runway higher. Both monthly MACD and RSI are providing bearish signals.
Yields for the U.S. 10-year Treasury jumped Friday, advancing for a fourth day out of five, with both the MACD and RSI triggering bullish signals.
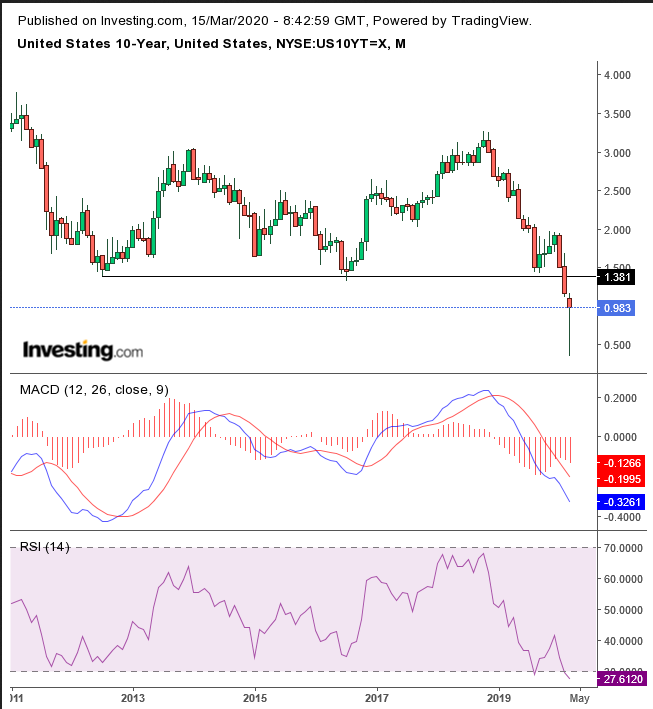
An imperfect but powerful hammer (upper shadow) is developing on the monthly chart, for now, but look at the impenetrable resistance above, under the 1.4 level.
The dollar jumped 1.3% on Friday, posting its best week since 2008, the fourth straight day of gains, totaling 4.1%.
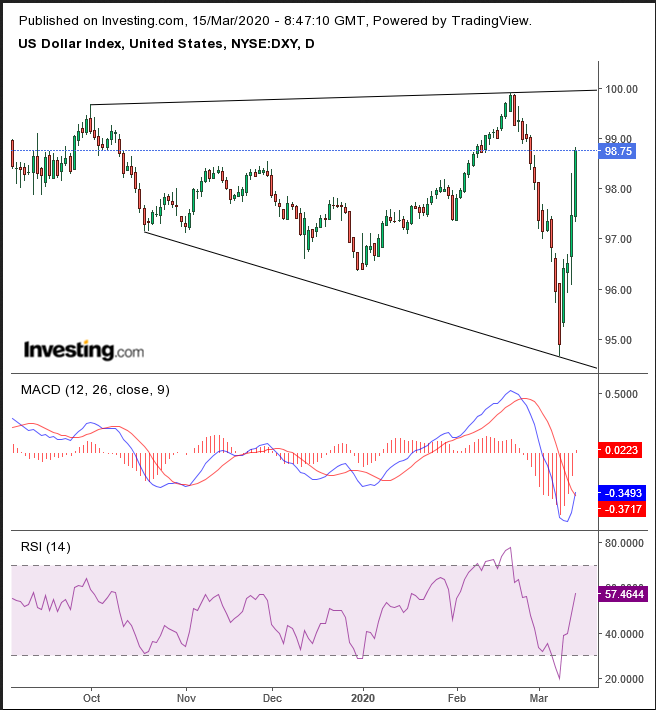
The RSI rebounded from the most extreme oversold condition since January 2018; the MACD just triggered a buy signal. We would urge caution, however, due to a broadening top, this is the same pattern that has been developing for equities since January 2018.
Gold has closed below its uptrend line since May 30, with both the MACD and RSI now in bearish formations.
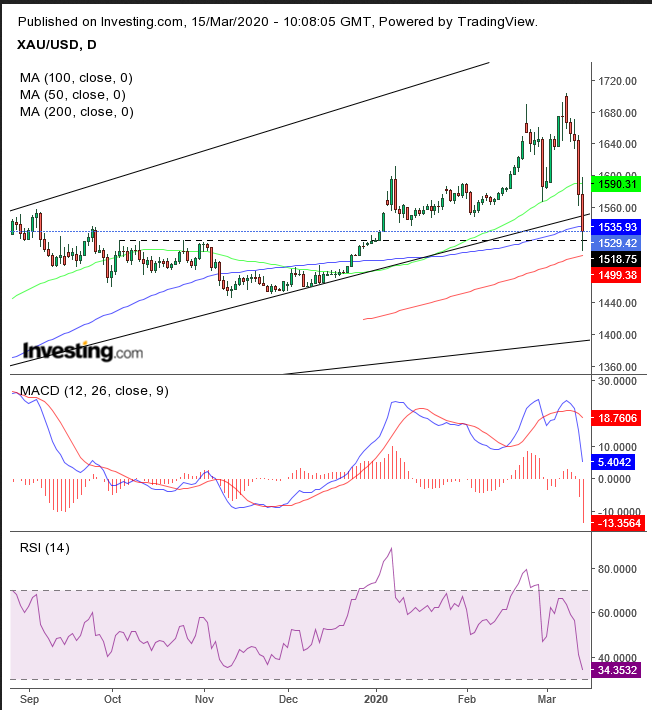
On the other hand, the precious metal's price found support by the October-November highs and the 200 DMA. The yellow metal's freefall put a dent in the term “safe haven asset.” Gold was down 8.7% last week and may continue to slip further. Last week it was just another sellable asset as investors returned to cash for margin calls; the underlying, physical transactions related to futures contracts, normally conducted in person, are likely to be disrupted.
Oil rebounded from a 1.4% decline, flipping to a 0.7% advance after Trump said the Department of Energy would purchase oil for America’s strategic petroleum reserve.
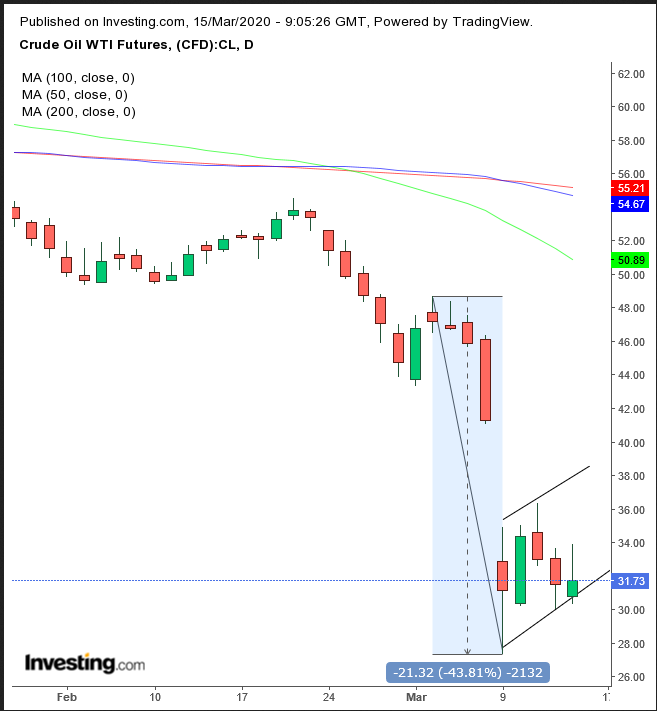
This followed the commodity's worst one-day selloff since the Gulf War in 1991. Technically, the price bounced off the bottom of a rising flag, bearish following the near-44% anvil-shaped plunge in just five sessions that preceded the exchange of contracts that is developing the body of the flag.
Week Ahead
All times listed are EDT
Sunday
22:00: China – Industrial Production: expected to plummet to 1.5% from 6.9%.
22:00: China – Retail Sales: anticipated to have plunged to 0.8% YoY in February from 8.0% YoY in January.
Monday
20:30: Australia – RBA Meeting Minutes
Tuesday
5:30: UK – Claimant Count Change: believed to have catapulted to 21.4K from 5.5K the month previous.
8:30: U.S. – Retail Sales: seen to have edged down to 0.2% in February from 0.3% in January.
Wednesday
6:00: Eurozone – CPI: expected to remain at 1.2% YoY.
8:30: U.S. – Building Permits: likely to have declined to 1.505M from 1.550M.
14:00: U.S. – Fed Interest Rate Decision: markets are expecting another cut, to 0.5% from 1.25%.
14:30: U.S. – FOMC Press Conference
Thursday
4:30: Switzerland – SNB Interest Rate Decision: with rates currently at -0.75%, the lowest interest rate in the world, markets are expecting the Swiss central blank to hold.
8:30: U.S. – Philadelphia Fed Manufacturing Index: projected to plunge to 10.0 from 36.7.
Friday
8:39: Canada – Core Retail Sales: expected to have dropped to 0.2% in January, from 0.5% the month previously.
10:00: U.S. – Existing Home Sales: forecast to have advanced to 5.50M from 5.46M.
