- Though stocks ended lower for the week, the SPX had its best month since January
- Dow scored its best June since 1938
- Yields, however, are depressed, demonstrating the dichotomy of this market
Stocks are likely to open higher on Monday, in the aftermath of the sideline meeting at the G-20 summit in Osaka, Japan between U.S. President Donald Trump and China's President Xi Jinping. The face-to-face between the leaders of the world's two largest economies has brought about a truce on tariffs—at least for now—as the pair agreed to work toward a settlement of the ongoing trade war.
However, though the U.S. agreed to remove some constraints on Huawei's purchasing of American-made high-tech equipment and China will once again start purchasing U.S. agricultural commodities, investors must realize it’s only a temporary fix since no actual agreement details have been forthcoming. The issue of intellectual property remains problematic and many believe both leaders were simply trying to mitigate an already slowing global economy. Indeed, just today, China downplayed the 'deal', warning there is still a lot of work ahead before an amicable accord can be reached.
SPX's Best Half-Year Since 1997; Dow's Best June Since 1938
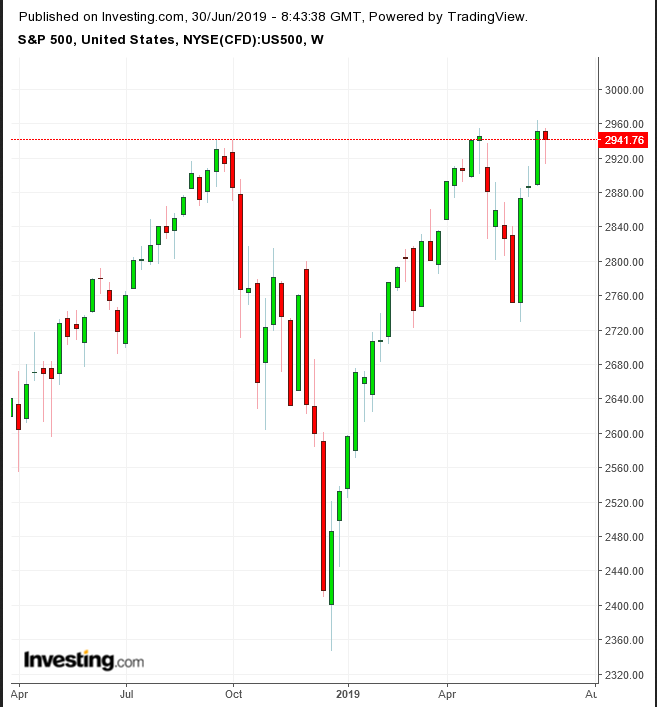
Although stocks finished lower for the week, the S&P 500 Index notched its best month since January and its best half-year since 1997. It jumped 17.3% over the first two quarters of 2019, to hit a fresh record.

The S&P 500 gained 6.89% in June, erasing nearly all of May’s losses, trimming them to an insignificant 0.14%. Previously, the benchmark gained 17.51% over four straight months, January through April. After May’s downward correction, the second quarter added 3.79% of value. However, even ignoring May’s sharp decline (which erased 2.5 months of gains), June’s almost equally sharp rebound still closed 0.14% lower than May.
Technically, the benchmark formed a weekly hammer, at the very same price level as the late-April weekly hammer. A lower weekly close would confirm its bearish implication. The first week of May confirmed the April hammer, closing 2% lower for the week and as much as 7% down till the beginning of June. The earlier hammer confirmed a resistance in affect since September 2018. Will we see the same this week, or will the tariff postponement change the dynamics? To our regret, we’d say chances are just 50/50.
Materials outperformed for the month, (+10.94), led by crude’s biggest gains since January. Chipmakers saw their best monthly gains since 2011 as U.S semiconductor manufacturers found legal ways to circumvent the administration’s ban on Huawei.
The Dow closed its best June since 1938, climbing 7.2% for the month.
Yields Lower; Gold, Oil Higher
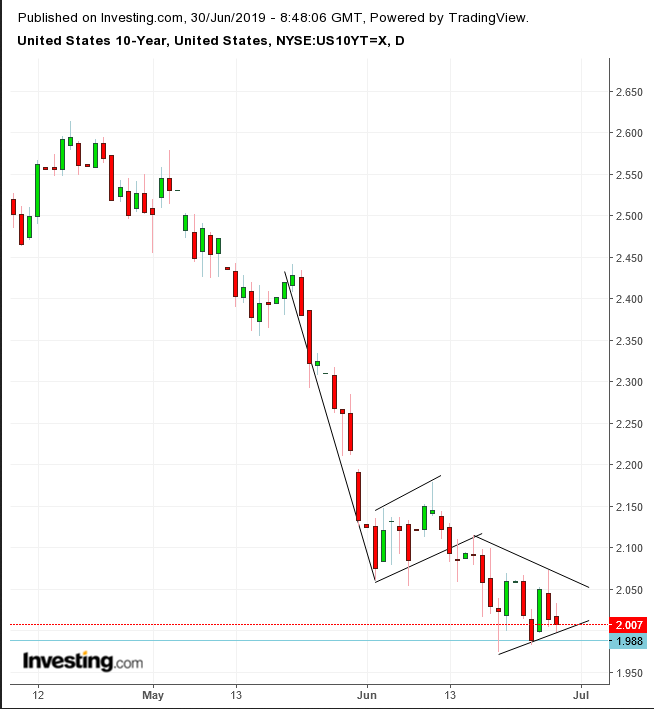
Despite exuberant equity gains, yields finished near their lowest level since 2016. Gold rallied the most since the 2016 and oil is expected to rebound after OPEC and Russia agreed to extend their production cut deal.

Even with equities moving higher, investors have been amassing Treasury holdings. This follows the Fed's recent dovish tilt. It makes sense that investors would buy Treasurys now, ahead of an expected rate cut. However, falling yields, particularly yields at multi-year lows—which having wiped out all gains since Trump won the presidency in November 2016—are never good for stocks. Investors understand that leads to economic contraction.
Technically, yields are forming a bearish pennant, right after completing a bearish flag. A downside breakout would confirm another plunge ahead.

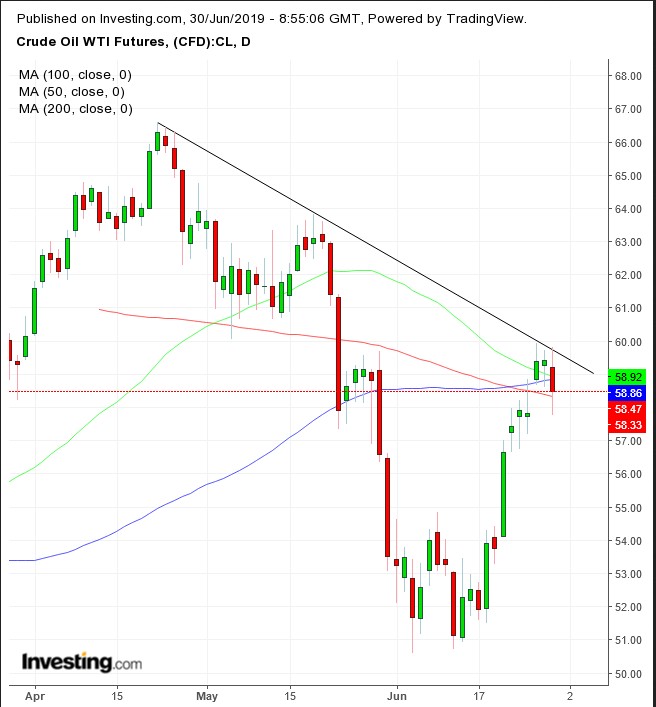
Though oil prices plunged on Friday, they're likely to rebound after Russia and Saudi Arabia finally reached a deal to extend production cuts. Technically, we expect such a rebound to be in correction mode, as the price confirmed the resistance of the downtrend line since April.
However, a reversal is not impossible; the price found support above the 200 DMA—which would make sense if China and the U.S. are able to make substantial trade progress.
Paradox Of This Economy
Last week also brought the close of Q2, making this current U.S. economic expansion the longest running on record. It goes back to 2009, surpassing the 1991-2001 cycle.
However, growth has been sluggish, with an average 2.3% GDP, well below the overall expansion average of 3% GDP, and a 4.3% average for the other three expansions that lasted more than seven years. Ironically, this may be a primary reason for the current expansion’s longevity.
We've written extensively about post-QE investors turning bullish on economic weakness, expecting the Fed to step in with further accommodation, while turning bearish on economic strength as they become fearful of Fed tightening. Investors still might rely on the historically low unemployment rate, rising corporate profits, albeit at a realistic pace (not the more than 20% growth last year), all topped off by lower interest rates, with an anticipated Fed rate cut expected in July.
Having said that, however, it's worth also keeping track of manufacturing weakness, which the market narrative attributes to trade uncertainty. In the background, there remains the threat of the U.S.-Iran conflict, Brexit and U.S. election-related and other political dramas.
The Week Ahead
All times listed are EDT
Monday
3:00: China – PBOC Gov Yi Speaks: investors will focus on any developments after China's central bank announced in late May it would take over the unlisted Baoshang Bank for a year on the heels of the bank's having faced a cash crunch. The takeover led to fears of liquidity risks.
10:00: U.S. – ISM Manufacturing PMI: expected to contract to 51.3 from 52.1, where 50.00 is the red line between economic expansion and contraction.
Tuesday
10:05: U.K. – BoE Gov Carney Speaks: Look for comments regarding new regulations after some investment funds suffered major losses, as they were “built on a lie.”
Wednesday
4:30: U.K. – Services PMI: likely to remain at 51.0.
8:15: U.S. – ADP Nonfarm Employment Change: after last month’s 27K bomb, economists expect 140,000 new jobs. While more representative of the overall labor market, it would still be the second lowest figure for this release in the last 12 months, after November’s 136,000 read.
10:30: U.S. – Crude Oil Inventories: the previous read saw the largest drawdown since 2016 on the outlook for shrinking demand amid an economic slowdown due to the ongoing trade war. This weekend's truce would presumably support demand. However, just as we’ve seen Chinese rhetoric begin to tamp down expectations only one day after the meeting, a lot could happen or be tweeted before the next release.
Thursday
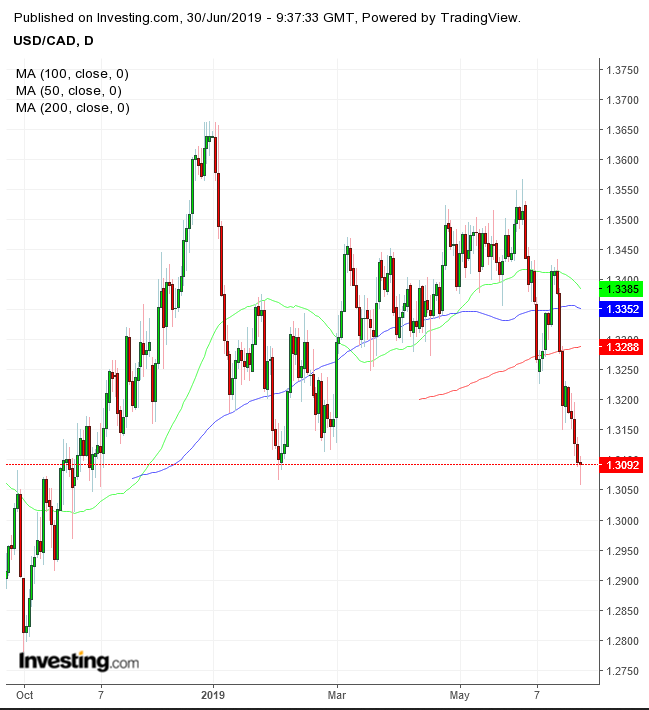
3:00: Canada – BoC Gov Council Member Lane Speaks: traders have been testing the central bank’s pain threshold, buying the loonie, pushing it to its highest since October 2018. Any hawkish tilt would confirm the February low’s support.

Friday
8:30: U.S. – Nonfarm Payrolls: seen to surge to 164K for the month of June, precisely the same number as the average monthly job gain for 2019; up from the 90K a month earlier.
8:30: Canada – Unemployment Rate, Employment Change: the unemployment rate is likely to remain edge up to 5.5%, while the employment change is seen to drop to 5.0K from 27.7K last month.
