- Equities climb; breadth and volume fall
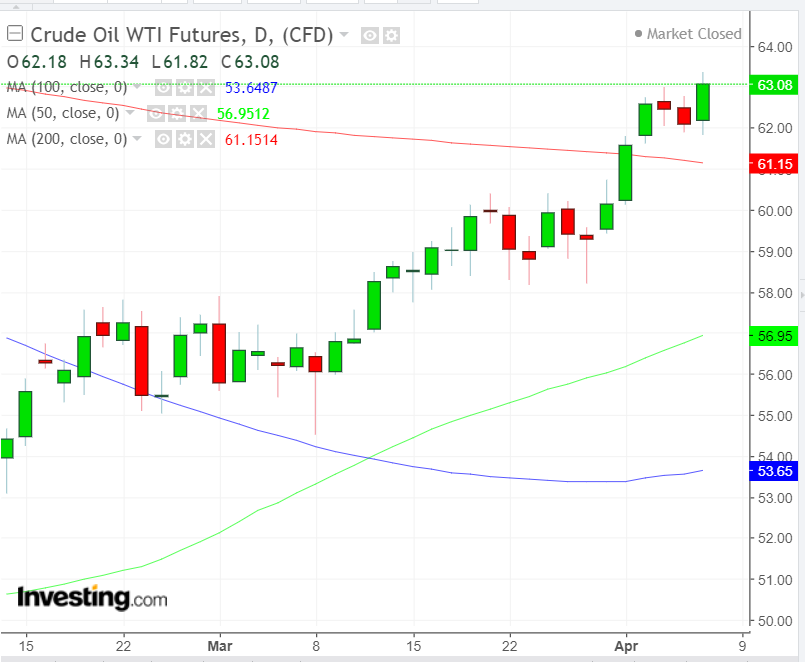
- WTI advances for the 6th week, longest streak since 2017
- Treasury curve flattens as Trump demands quantitative easing
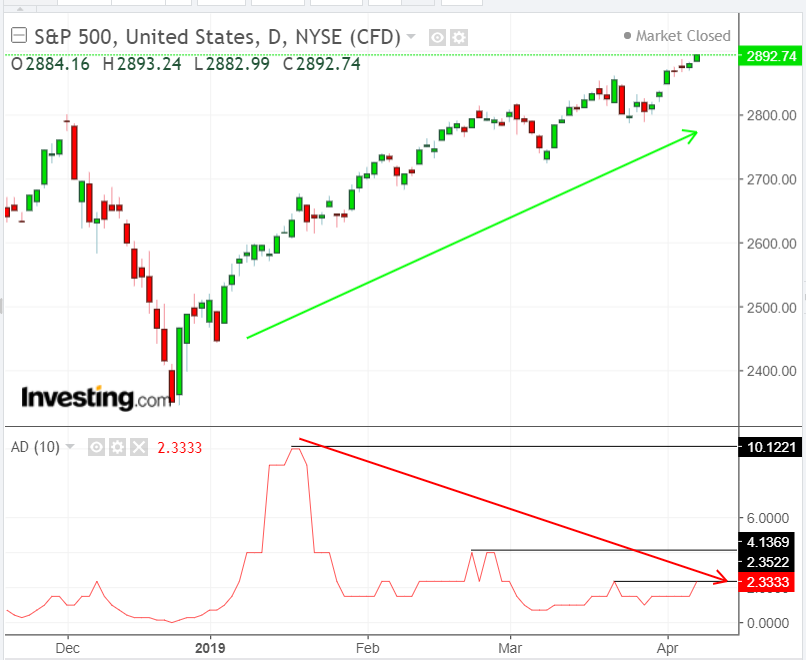
Even as yields fell for a second day on Friday and the dollar rose, U.S. equities pushed higher, toward record peaks, after the monthly Nonfarm Payrolls release showed that the job market is growing amid tepid inflation, egging on U.S. President Donald Trump to increase pressure on the Fed to further ease policy. However, a stark divergence between market breadth and volume versus exceptional gains hoisted a red flag.
Red-Hot Warning Signs Amid Soaring Equities
The S&P 500 rose 0.46% on Friday, moving higher for a seventh straight day. Just about all sectors were up, with the sole laggard, export-sensitive Materials, down just 0.03%, even as Trump boasted that an ‘epic’ trade deal was near completion. On the opposite side of the spectrum, Energy advanced (+1.76%) tracking crude above $63 for the first time since Nov. 5 2018, as the U.S. employment report beat expectations which, compounded by positive sentiment on what appear to be forward-moving trade talks, eased growth concerns. The sector was nearly a full percentage point ahead of the second-best performing Real Estate sector (+0.77%).
The benchmark jumped 2.06% for the week, for the second consecutive week, gaining 3.29% over the full period, with just defensive sectors Consumer Staples (-0.93%) and Utilities (-0.12%) in negative territory. Despite Friday’s underperformance, Materials (+4.18%) led the weekly rally, followed by Financials (3.46%).
That's surprising considering the Fed's dovish stance alongside a president pressuring the central bank to cut rates rather than hold as isn't bullish for banks. As well, falling yields are signaling a depressed outlook for interest rates and thus lower profits for financial institutions. Perhaps banks have done so well over the last week thanks to their weakness, reeling in speculators because of their cheaper valuations.
Technically, the SPX’s divergent market breadth is flashing red-hot warning signs even as the price challenges its Sept. 20-record close, just 1.31% below where the index closed on Friday. At the same time, according to MarketWatch U.S. stock funds have been hemorrhaging, as outflows escalate—now at $39.1 billion YTD; concurrently, volume has been uncharacteristically thin for such a strong rally, challenging analysts—ourselves included—to believe in this rally. We expected the rally to end at the 2,800 levels and are now attempting to understand this apparent conflict as the result of company buybacks, though we aren’t convinced.
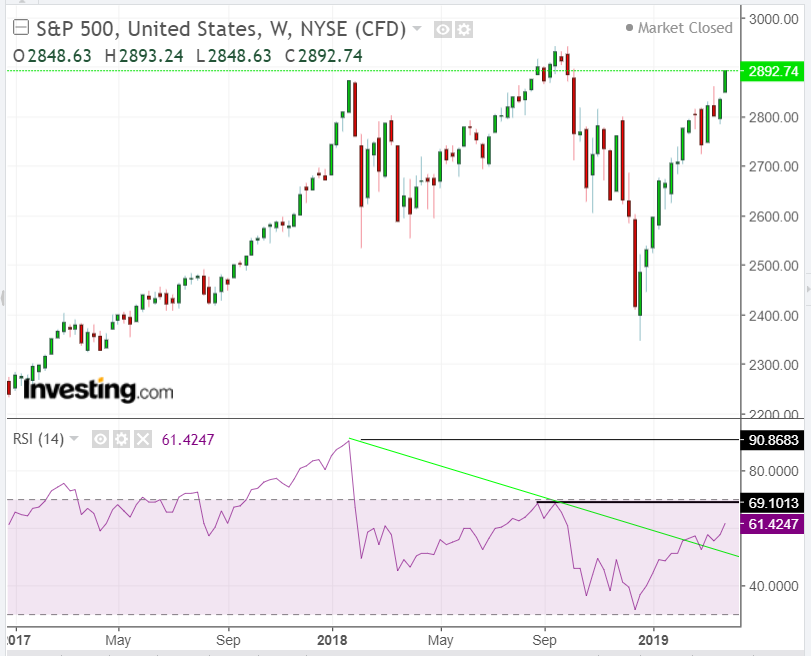
Another divergence worth paying attention to, albeit not mentioned in the MarketWatch article, is the weekly RSI's negative divergence. While the price in September beat the January record, momentum failed to post higher. As of now, momentum is still lower than it was in September, though it broke the downtrend line, creating the potential for rising momentum.
The Dow Jones Industrial Average gained 0.15% Friday, its highest close since Oct. 8. For the week, the 30-component, mega cap benchmark jumped 1.91%, also for a second consecutive week, surging 3.62% for the full period. Technically, Friday’s trading formed a Doji, suggesting a potential reversal, after completing a symmetrical triangle, bullish in an uptrend. However, market breadth and momentum created the same negative divergences as the SPX, painting a seriously mixed picture.
The NASDAQ Composite notched a 0.59% gain on Friday, +2.73% rally for the week, the second in a row, totaling 3.9%. The tech-heavy index found resistance by Wednesday’s Doji. It too is providing the same divergences as peer indices.
The Russell 2000 leaped 1.11% on Friday, the outperformer among the major U.S. benchmarks, after breaking out of a descending channel, falling at the height of the session, yet keeping gains above the 200 DMA, joining the other major indices. Nonetheless, the same divergences are plaguing the small cap index as well.
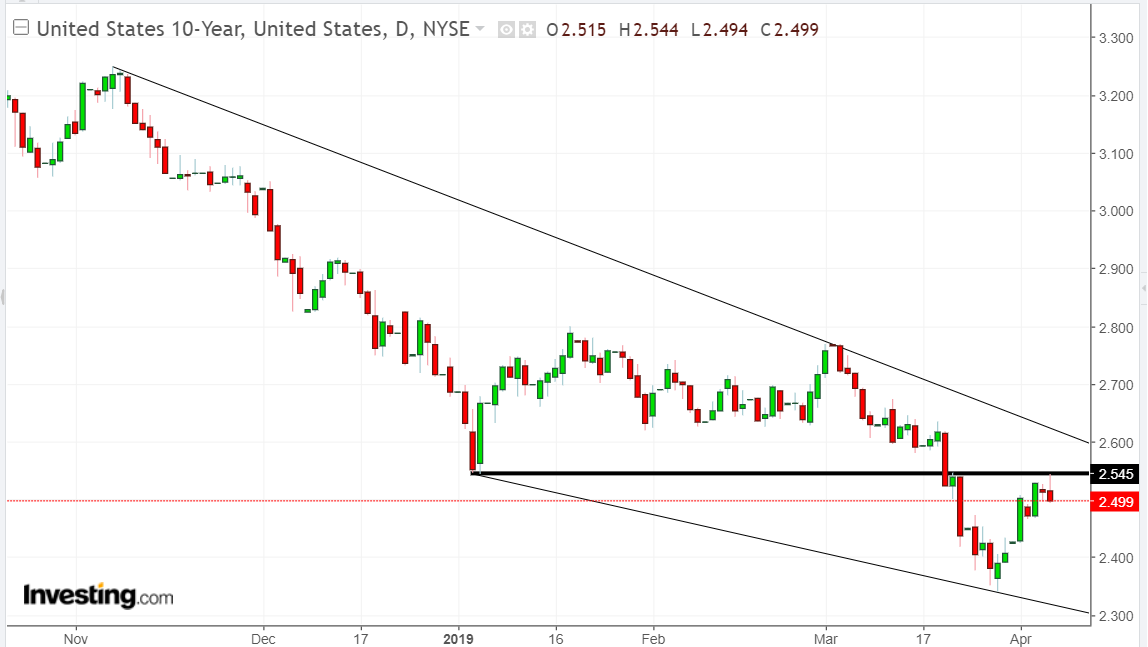
A third divergence is falling yields, which occurred even after Friday’s jump on strong jobs gains. Two-year yields logged their biggest weekly gains in five months, something that occurs when investors decrease Treasury holdings. Typically, stocks and yields move in tandem, as traders rotate capital out of Treasurys and into equities on risk, while back pedaling into Treasurys when turning risk-off.
Why then, have Treasurys been gaining along with equities? A possible explanation is that the recently dovish Fed, compounded by languishing inflation, suggests lower rates are on the horizon, making current rates more attractive.
However, in the longer view, falling inflation may weigh on the economy, pressuring company profits. In that scenario, traders who were driving up stocks would stampede out, causing a market crash. So, in our final analysis, yields too are providing an adverse omen for stocks.
Fundamentally, however, the U.S. economy added 196,000 jobs, with an unemployment rate remaining at an historically low 3.8%. It's one of the longest-lasting job and growth expansions on record. So how do we reconcile multiple technical warning signs with such exuberant fundamentals?
The technical explanation would be that fundamentals and technicals tend to agree in the midst of an economic move, but diverge at the end of a move. In other words, technicals are a leading indicator ahead of fundamental changes.
The fundamental explanation may be that many of the jobs currently in growth mode are on borrowed time. Automation is about to put an untold number of workers on the street, individuals with no additional, marketable skills to find gainful employment again, amid the biggest industrial revolution in three centuries. Of course, we don’t have a timeframe for this fundamental change so can't predict when this would happen.
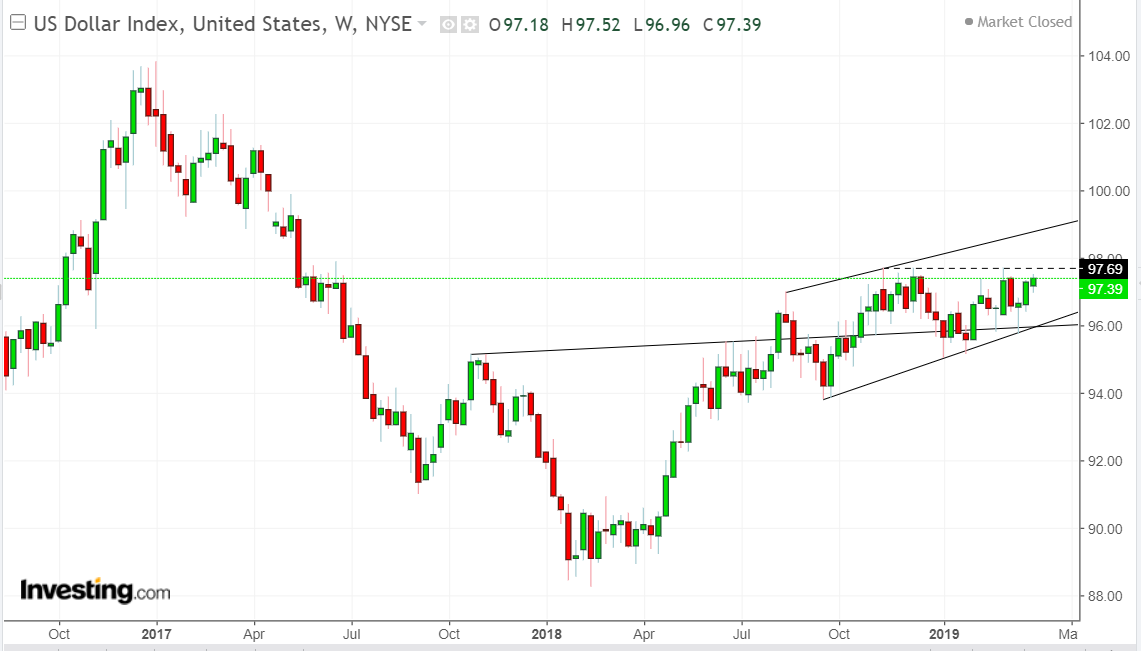
The dollar index climbed for the third week, after the NFP beat. The price challenged the resistance since early November to the medium-term uptrend, potentially extending the upside breakout of a H&S bottom.
Oil closed above $63 for the first time since Nov. 5, locking the week's performance above the 200 DMA, after falling below it in late October. This was crude’s 5th week of gains, the commodity's longest streak since 2017, a result of tight supply.
Week Ahead
All times listed are EDT
Monday
10:00: U.S. – Factory Orders (MoM) (Feb.): forecast to fall by 0.5%
Tuesday
10:00: U.S. – JOLTs Job Openings (Feb.): expected to edge down to 7.565 million from 7.581 million.
Wednesday
4:30: U.K. – GDP (MoM): seen to drop to 0.2% from 0.5%.
4:30: U.K. – Manufacturing Production (Mom) (Feb): expected to plunge to 0.2% from 0.8%.
10:30: U.S. – Crude Oil Inventories: Last release showed 7.238 million barrels.
14:00: U.S. – FOMC Meeting Minutes: Will the Fed signal further easing, per President Trump’s demands to drop interest rates and increase the balance sheet?
Thursday
8:30: U.S. – PPI (MoM) (March): expected to climb to 0.3% from 0.1%.
Friday
13:00: U.S. – Baker Hughes Oil Rig Count: U.S. production has surpassed Saudi Arabia's, making the U.S. the world’s largest producer, and weakening OPEC+ power to manipulate oil prices. Will rising rig counts suggest added U.S. production and additional competition for foreign producers?

