- Despite trade progress pessimism drives investors
- Utilities post record close, signaling risk aversion
- Yields, dollar drop
For a second week, all major US indices fell, closing at their lowest levels in at least nine months. As of Friday, the Dow Jones Industrial Average fell more than 10% below its October peak.
Stocks sold off violently to finish the trading week, with the S&P 500, NASDAQ Composite and Russell 2000 joining the mega cap Dow to all end in the red. With the Dow's negative Friday finish, all four major US indices are now officially in correction territory.
Despite reports of trade progress and robust holiday spending, pessimistic investors focused instead on the perceived challenges of the upcoming year, following the almost across-the-board soft guidance meted out by companies during the just-ended earnings season and a slowing global economy.
Positive Fundamentals Developments, Pessimistic Investors
Positive trade developments included: signals that China would become more welcoming to companies based abroad; indications that the country will also resume buying US agricultural products including soybeans; and an announcement by the Chinese government that it would temporarily suspend retaliatory tariff hikes on US cars and auto parts, returning levies to July levels. Tesla (NASDAQ:TSLA) and BMW (OTC:BMWYY) immediately priced-in the lower tariffs, cutting prices in China as way of bolstering falling local sales in the world’s largest auto market.
However, based on November Industrial Production information released late last week, China's economy slowed more than expected in November, with slower growth in retail sales as well—including auto sales set for its first yearly loss since 1990.
On the other hand, US economic data was encouraging. Retail sales grew faster than expected, supported by strong consumer confidence, rising wages and low unemployment.
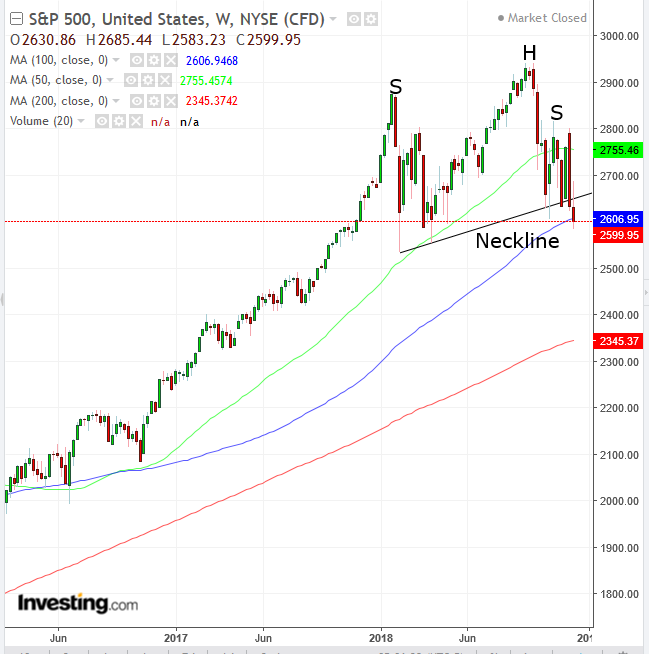
The S&P 500 tumbled 1.91 percent on Friday, pressured by Health Care (-3.37%) and Technology (-2.45%) shares, to close at the lowest level for the benchmark since March 29. On a weekly basis, the index slipped 1.26%, for a second week and a total of 5.83%.
Technically, the SPX may have completed a H&S top reversal. Just beware of a bear trap, as its downside breakout was less than 2%—though a weekend negative closing demonstrates bearish commitment. In addition, the price struggled at the 100 WMA. Since its September record peak, the S&P 500 has fallen 11.25% thus far.
The Dow plunged almost 500 points on Friday, for a 2.02% loss. The 30 component index was dragged down by shares of Johnson & Johnson (NYSE:JNJ), which plunged 10.04 percent , erasing $38 billion of market value, its sharpest daily selloff since 2002. Investors dumped the stock after a Reuters report was published, alleging the company knew there were traces of asbestos in its baby powder as early as 1971.
Analysts at JPMorgan say that while the story is likely to endure, keeping prices depressed for an “extended period of time,” the issue has already been reported and is therefore no longer news, suggesting the selloff was exaggerated.
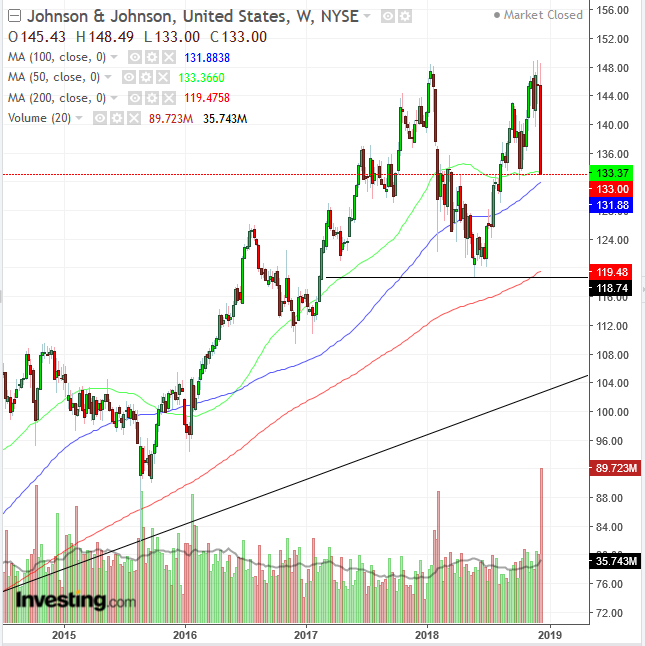
Technically, however, the price may be forming a double bottom, which would be complete if the price of the stock falls below 118.
For the week, the Dow was down 1.18%. The decline brought the total selloff since the index's April record high to 10.17%.
The NASDAQ Composite was the clear underperformer on Friday, plunging 2.26%. On a weekly basis, however, it outperformed the other major indices, trimming just 0.84 for the week, reflecting the wild mood swings investors are going through. The tech-heavy index has fallen 14.8% since its February record high.
The small cap Russell 2000 was the week's outperformer, falling only 1.72% on Friday. That's ironic considering the positive trade-related reports. Small caps have tended to fall on an improved outlook on exports, since that benefits multinationals at the expenses of domestic firms.
But, as with the NASDAQ, we're seeing a divergence between market activity on Friday versus the rest of the week. The small caps index dropped 2.57% for the week, making it the worst performer on that basis, reflecting market volatility from another perspective. So far, the Russell 2000 has dropped 19 percent since its August record peak. That leaves it just 1 percent away from a bear market.
Just prior to Friday's market rout, another sign of investor pessimism surfaced when Utilities shares hit an all-time high on Thursday. That's a red flag for risk assets, signaling that investors are losing faith in growth.

Technically, the Utilities Select Sector SPDR ETF (NYSE:XLU), which is a proxy for the sector, is trading at the top of a rising channel, whose supply line may push prices back toward the channel bottom, but still remain within an uptrend.
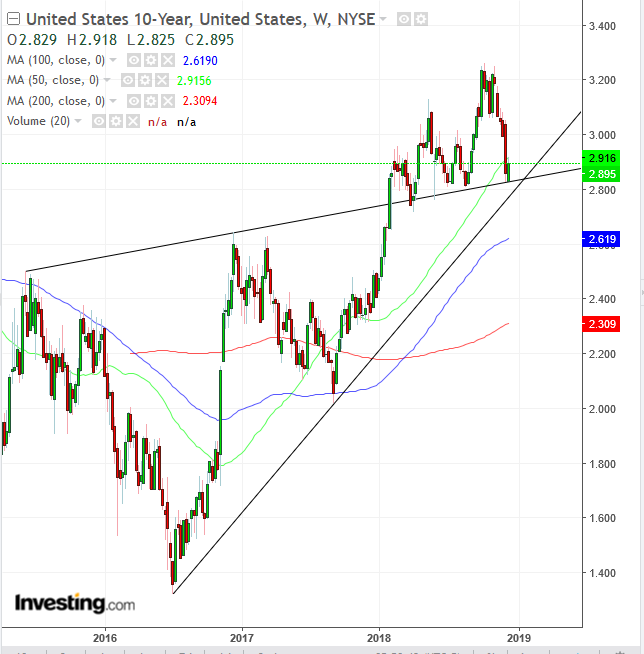
The yield on 10-year Treasurys dropped Friday, as investors rotated out of equities. However, on a weekly basis, they ended higher, confirming the support of a previous resistance, the supply line since mid-2015, as well as the uptrend line since mid-2016.
The pressure at these two converging trendlines is a visual representation of the current market dynamic. Should yields fall below 2.8, they would increase the bearish picture, as demand for Treasurys will break through a confluence of supports, demonstrating increasing pessimism in growth.
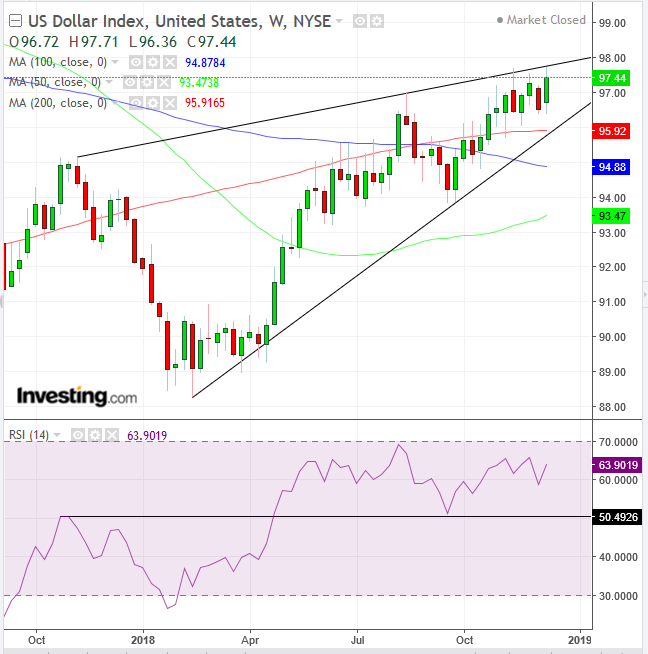
Though the dollar fell on Friday, it advanced for the week. Technically, it's being squeezed within a rising wedge, which is bearish in a downtrend. Note the set-up for a downside breakout, the contracting moving averages beneath the price action. Also, the RSI is setting up a double top, with a neckline at the 51 level.
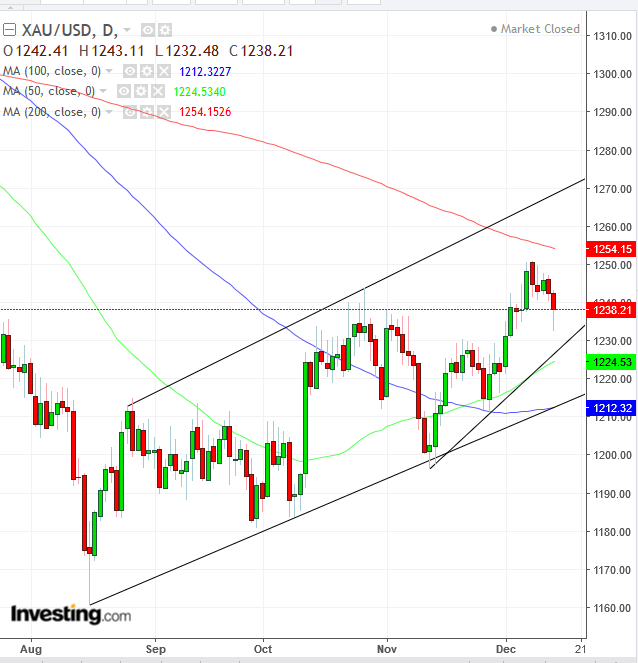
In mirror image of the global reserve currency, the price of gold is set to scale above the 200 DMA, as it trades within a rising channel, which may boost the precious metal further.
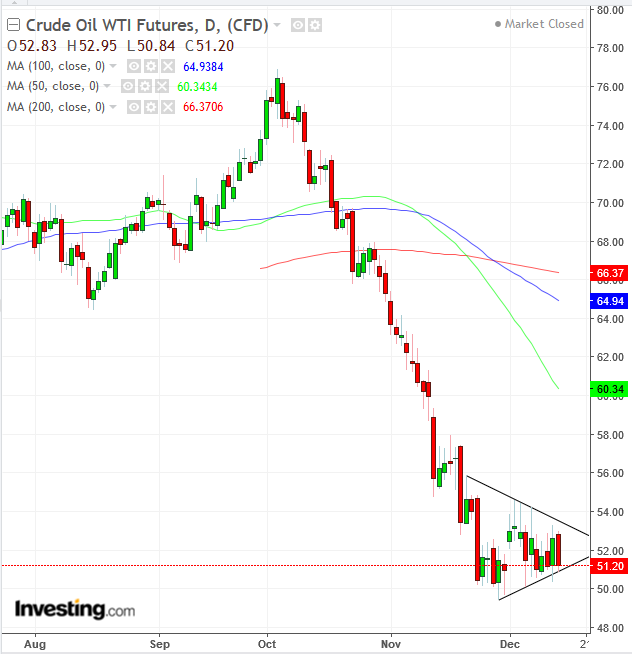
The price of oil also fell on Friday. The commodity stayed within its pennant, whose downside breakout would signal a resumption of the underlying downtrend. However, should prices meander through the apex, the pattern’s bearish bias would fizzle.
Elsewhere, UK Prime Minister Theresa May may have won last week's parliamentary confidence vote, but she left the EU summit empty handed. Still, it's possible France's President Emmanuel Macron may have had an even worse week. He back-pedaled on a fuel tax hike and on a tax on pension benefits while introducing monthly bonuses of 100 euro to minimum-wage workers to quell 4 weeks of violent protests.
That package will add approximately €10 billion to France's budget deficit, pushing it well above the EU limit of 3% of GDP. This move could not have come at a worse time for the EU, after it coerced Italy with disciplinary measures to reduce that country's deficit to below 2%.
The ECB added to growing concerns of economic growth and geopolitical upheavals. During last week's press conference the European central bank reduced its growth outlook, even as it winds down QE.
The Week Ahead
All times listed are EST
Monday
8:30: US – NY Empire State Manufacturing Index (December): expected to fall to 20.10 from 23.3.
Tuesday
4:00: Germany – IFO Business Climate (December): business climate index to edge down to 101.8 from 102. Markets to watch: EUR crosses
8:30: US – Housing Starts and Building Permits (November): watch for a rebound from last month’s decline in activity, as the US housing market continues to worry investors.
Wednesday
4:30: UK – CPI (November): inflation to fall to 2.3% YoY and Core CPI to fall to 1.8% YoY.
8:30: Canada – CPI (November): CPI to fall to 1.9% YoY from 2.4%.
10:00: US – Existing Home Sales (November): sales to fall -0.6% MoM from a 1.4% increase the precious month.
10:30: US – EIA Crude Inventories (w/e 14 December): stockpiles to edge down to 2.990M from 1.208M million barrels.
14:00: US – Federal Reserve Rate Decision: rates are expected to rise to 2.5% from 2.25%, but the main focus will be on the Fed's future path. We may get some hints about this from the FOMC statement and press conference at 14:30.
19:30: Australia – Employment Data (November): unemployment rate to remain flat at 5%, with 20,000 jobs to have been created.
22:00: Japan – BoJ Interest Rate Decision: no change in policy expected.
Thursday
4:30: UK – Retail Sales (November): sales to rise 0.3 % from -0.5% MoM, while falling 1.9% from 2.2% YoY.
7:00: UK – BoE Rate Decision: no change expected.
18:30: Japan – CPI (November): prices to rise 1.4% YoY, and core CPI to rise 1%.
Friday
4:30: UK – GDP (Q3, final): growth expected remain steady at 0.6% QoQ and 1.5% YoY.
8:30: US – Core Durable Goods Orders (November): forecast to rise 0.3% MoM.
