- Stocks fall on Friday as NFP paves way for higher rates
- But solid data, best labor market in 50 years prove economy can withstand tightening
- Dollar falls below uptrend line, again
Though we predict that US stocks will continue to hit fresh records longer-term, on Friday all major indices—the S&P 500, Dow Jones Industrial Average, NASDAQ Composite and Russell 2000—slipped lower, as US equity markets experienced their worst week in a month.
Strong economic data during the course of the week, including a robust Services PMI, expanding Factory Orders and an almost 50-year low Unemployment Rate helped fuel speculation of continued Fed rate hikes. As well, Treasury yields continue to rise, spurring investors to sell riskier stocks in favor of safer bond holdings.
Additional headwinds for stocks last week included the ongoing escalation of the US-Sino trade dispute. Still, despite the removal of unprecedented accommodation, the healthy economic outlook together with "perhaps the best" labor market in 50 years, according to Gus Faucher, chief economist at PNC, signal equities will have more room to run.
Treasurys Sell Off, Equities Follow As Yields Rise

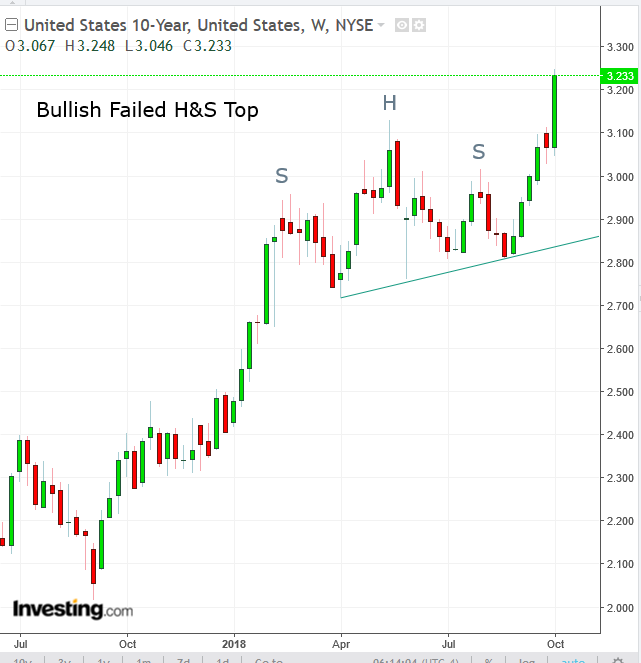
Nevertheless, strong economic data compounded by a hawkish statement from Fed Chair Powell drove a Treasury selloff, pushing 10-year yields to their highest levels in seven years. Although Friday's employment report disappointed on job creation, it hit the lowest unemployment level since 1969, reinforcing the Fed's path for interest rates, deepening the US bond selloff and pushing the yields to above 3.2, the highest since May 2011.
Technically, 10-year yields formed an H&S top between mid-February and mid-August. However, its blowout reverses all the localized downward pressure, turning it into an upward catapult, establishing an outlook for continued rallies for bond yields.
On Friday, S&P 500 fell Friday 0.55 percent. Nine of the index's 11 sectors turned red, led by Technology shares (-1.23 percent). Utilities (+1.53 percent) was the only sector that advanced. The benchmark index retreated 0.87 percent for the week.
The Dow Jones Industrial Average slumped 0.68 percent on Friday, dragged down by Intel (NASDAQ:INTC) which lost more than 2 percent of value after Bloomberg reported on Chinese hacking via tiny microchips used to steal intellectual secrets from large US companies and government contractors. For the week, however, the Dow was flat, falling just 0.04 percent.
The NASDAQ 100 plummeted 1.21 percent for a weekly setback of precisely 3 percent.

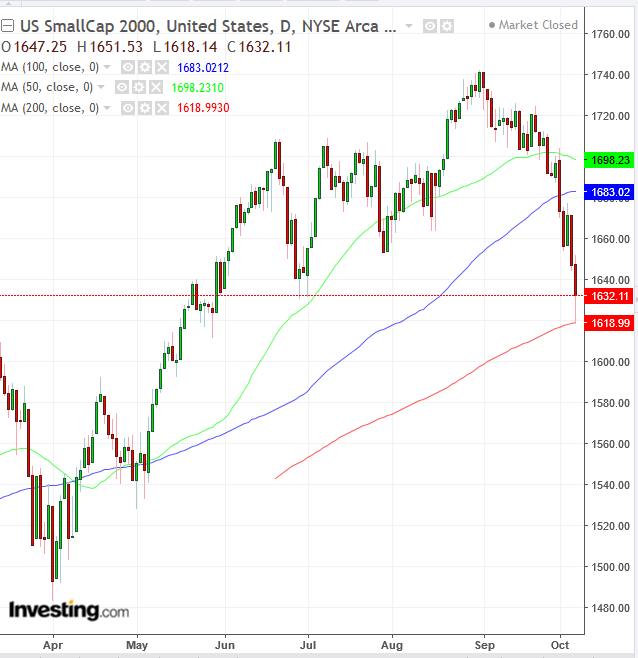
The Russell 2000 fell 0.9 percent on Friday, finding support above the 200 DMA. It plunged 3.8 percent on a weekly basis, making it the clear laggard for the week, finding support above the 50 WMA. Losses were triggered by the so-called NAFTA 2.0 agreement, officially the US-Mexico-Canada (USMCA) deal that was signed early last week, which makes the flow of goods smoother for multinationals manufacturing or sourcing materials in those countries.Technically, the price has closed at the lowest level since May 29 and is threatening a top reversal.
The Dollar Index fell for a second day on Friday, after the NFP missed on job creation. The global reserve currency fell back below its uptrend line since May 14.

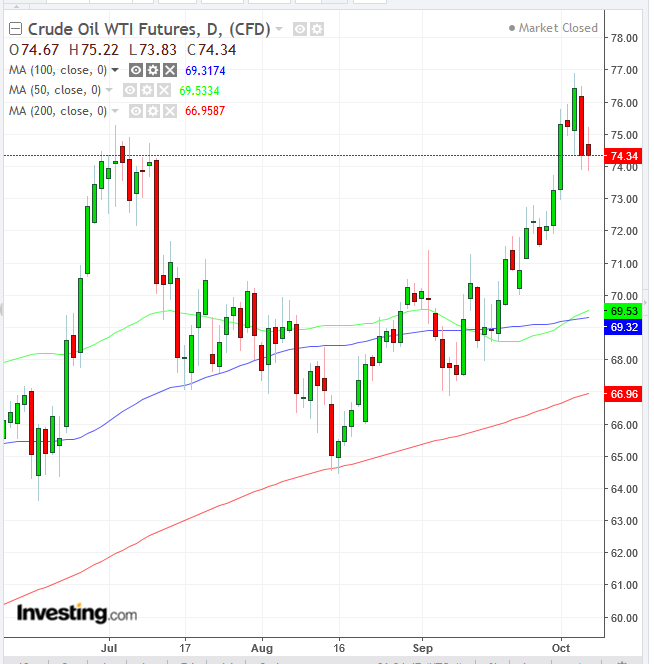
Crude oil slipped back toward $74, after nearing $77 on Wednesday. Markets brushed off a rise in crude oil inventories after data showed that US stocks jumped close to 8 million barrels last week, quadruple analyst expectations and the most significant build since March 2017.
Investors remain bullish on the commodity because of the November 4 start of US sanctions against Iran which will remove that countries oil from the global supply. Even China, which tends not to play ball in this arena—and is in perhaps the most significant dispute with the US right since it shot down a US plan during the Bush administration in 2001—has cut down its oil purchase from Iran by half. Technically, the price registered a new peak, confirming the uptrend; the 50 DMA also crossed above the 100 DMA.
Week Ahead
All times listed are EDT
Sunday
21:45: China – Caixin Services PMI (September): forecast to fall to 51.4 from 51.5.
Monday
Columbus Day in the US – markets open but some data delayed by a day
Canada – Thanksgiving Day
Japan – Health-Sports Day
20:30: Australia – NAB Business Confidence (September): index to rise to 5 from 4.
Tuesday
2:00: Germany – Trade Balance (August): surplus to widen to €16.4 billion from €15.8 billion.
Wednesday
4:30: UK – Trade Balance (August), GDP (August): trade balance to see a deficit of £10.90 billion from -9.97 billion, while GDP growth falls to 0.1% MoM from 0.3%.
8:30: US – PPI (September): forecast to be 2.8% YoY and 0.2% MoM, from 2.8% and -0.1% respectively.
Thursday
8:30: US – CPI (September): prices forecast to grow 2.4% YoY and 0.2% MoM, from 2.7% and 0.2% respectively. Core CPI to be 2.3% YoY from 2.2% and 0.2% from 0.1% MoM.
11:00: US – EIA Crude Oil Inventories (w/e 5 October): stockpiles to fall to 5.08 million barrels.
Friday
0:30: China – (Tentative) Trade Balance (September): trade surplus to narrow to $21 billion from $27.9 billion.
10:00: US – Michigan Consumer Sentiment (October, preliminary): expected to rise to 100.5 from 100.1.
