- All major US indices close the week lower on renewed trade war jitters
- NFP misses but wage growth supports higher income without inflation spike
- Earnings season expected to be best in eight years
- Domestic politics add to market uncertainty
After a second tumultuous week, during which traders repeatedly chased equities up, then down, on escalating, then waning, then once again rising trade war uncertainty—only to finish the week down across the board—where do markets head next? All major US indices finished the week lower: the Dow lost 2.34% on Friday, the S&P 500 slipped 2.19%, the NASDAQ Composite declined 2.28% and the Russell 2000 fell 1.92%
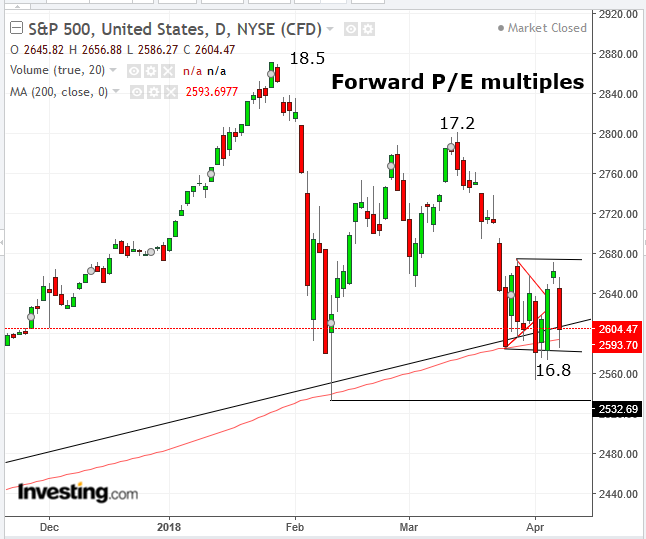
Of course, it's impossible to accurately predict with complete certainty where markets will go next. However, right now the S&P 500 is consolidating, meaning it’s going neither up nor down but rather sideways. This indicates that all supply and demand is being absorbed within a 90 point range or a 3 percent band, within the 2,675 and 2,585 levels on the S&P 500 Index.
In other words, the benchmark index is in a period when everyone who has an opinion about where the index should go next puts in his two cents by either buying or selling, while at the same time those who don't have an opinion wait on the sidelines for a conclusion: a breakout in either direction, to be determined by those who have a stronger opinion, which will then determine the trend. Since the stock market is, in essence, a glorified voting machine in which each dollar gets a vote, whichever side has more dollars and thus more votes will lead the breakout in that direction.
Along with the wobbly weekly price action, a significantly lower Friday close is worrisome, as it demonstrates that investors are not willing to commit to a weekend of optimism about markets and thus a higher close. This reflects an environment in which investors see the potential for a lot to go wrong.
Worrisome End Of Week Metrics
Another distressing signal: breadth supported the selloff, as all sectors traded lower. Defensive sectors with high yielding dividend equities outperformed, including Utilities, NYSE:Real Estate and Consumer Staples.
The worst performers were tech and internet stocks. Berkshire Hathaway (NYSE:BRKa) was a particular drag on the market, plunging 2.57%, possibly because investors could be viewing it as a broad proxy for the economy, sending a signal that a trade war would hurt overall economic growth.
Investors rotated out of risk assets and into safe havens such as bonds, the Japanese yen and gold, to finish the week.
Will Earnings Buoy Stocks?
Investors are hoping to hang on till earning season begins. The unofficial kick-off is at the end of this coming week when Citigroup (NYSE:C), JPMorgan (NYSE:JPM) and Wells Fargo (NYSE:WFC) report.
There are two reasons the corporate earnings reports released over the next few weeks will be significant. First, it’s basic dollars and cents. Actual metrics indicating company strength or weakness provide something more reliable than the geopolitical headlines and fear that have been whipsawing stocks over the past ten sessions.
Second, after the recent tax overhaul, analysts added 6 percent to their growth expectations, bringing this earnings season’s forecast to 18 percent. If realized, this would be the strongest growth in eight years.
Finally, even though earnings estimates have not changed, stocks are considerably cheaper on a forward P/E multiple. When the S&P 500 hit its February high, they were 18.5; at the March high the multiple was 17.2; now it's 16.8
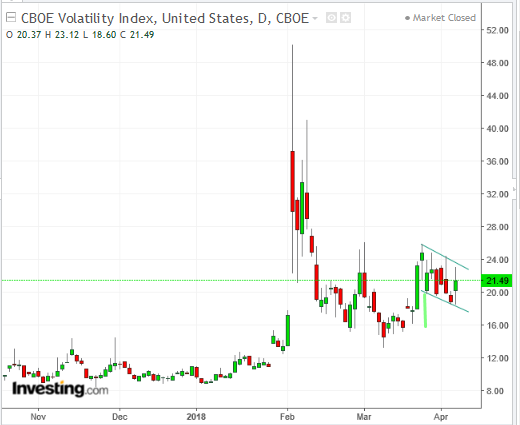
Last week we said that the S&P 500 provided a downside breakout of a bearish pennant (red lines in SPX chart, above). However, earlier last week, the sharp relief that followed lowered expectations of trade concerns allowed the price to blow the pattern out.
Now, while it’s possible the current consolidation could end up forming a bearish flag (black lines), the lack of proportion reduces the probability. As a matter of interest, however, a beautifully proportional bullish flag has been formed on the VIX chart. Should the same psychology of price action apply to fear reaction, an upside breakout may suggest a much higher VIX reading, the prelude to a sharp market decline.
Market Risks, Political Threats
On Friday, the monthly Nonfarm Payrolls release showed 103,000 new jobs were created in March, a bit more than half the 193,000 expected by economists. Perhaps because February’s number was revised higher, thereby keeping the longer-term trend of sturdy growth to a robust average of 201,000 jobs created in the first three months of the year, or because this monthly data was overshadowed by Trump's escalation of the possibility of a full out trade war, there was no palpable reaction to this major miss. Perhaps the modest uptick in inflation to 2.7 percent signaled that employment conditions are likely to lead to higher incomes—albeit not fast enough for a repeat of the early February panicked selloff on the outlook of a faster tightening, seen as slowing growth.
While the outlook for corporate earnings and economic growth support the view that stocks should rise, an escalation of the looming trade war risk and other political uncertainties may scare investors into selling off anyway. Traders may be concerned that President Donald Trump is just too unpredictable for a stable market.
Trump's new economic advisor Larry Kudlow said he'd just found out about the newest China tariffs on Thursday night, after markets, not a particularly auspicious way to begin his tenure. As well, Chief of Staff John Kelly has threatened to quit, according to Axios, adding to a long string of advisors who have voluntarily exited the administration or were made to leave.
Another potential threat, though seemingly unlikely right now, is that a trade war could be a classic lead-in to an actual war. The Tariff Act of 1930, also known as the Smoot-Hawley Tariff Act was meant to revive an economic slump. Instead it exacerbated the Great Depression, leading to a tariff face-off between the US and Europe. At that time, nationalist rhetoric increased, with nations blaming other nations for the poor economic conditions that ultimately led to WWII.
It’s perhaps noteworthy, therefore that in March, Trump prohibited Singapore-based Broadcom (NASDAQ:AVGO) from buying US-based Qualcomm (NASDAQ:QCOM), citing national security concerns. Indeed, it would have allowed the gap between US technology dominance and Asia to be closed. Of course, the current trade uncertainty began when Trump announced that the US would be levying taxes on imported steel and aluminum because unfair trade practices "were an assault to our country."
That paves the way, even if it’s still a long-shot, for the possibility of an all-out war. Just recently, Japan, a US ally, for the first time since WWII activated its marine defenses, to enhance protection against China.
However, before there's even talk of armed conflict, some believe China could harm the US via its $1.17 trillion-worth of US sovereign debt holdings. Should China reduce its Treasury portfolio as a way of hitting back against the US's tariff proposals, the dollar could enter a downward spiral, as other countries may follow suit and sell their Treasury holdings too.
While a bond selloff would also be bad for China since it would likely have to sell some Treasurys at a loss, still, China has a history of putting politics ahead of its economy. It could decide that it’s strong enough to absorb the loss.
Though there are those who are bearish on the economy, seeing flattening employment and slowing growth, most analysts and economists remain bullish. But geopolitics and domestic political uncertainty still have the ability to spike volatility and rattle markets. It makes sense, therefore that investors are hoping they can hold on till earnings season lifts markets and, if results match expectations, this will be the strongest earnings season since 2010. If that doesn't occur, bulls may have nothing left to hold on to.
And that would be a catalyst for a much more significant correction.
Key Economic Events
All times listed are EDT
Monday
1:00: Japan – Consumer Confidence (March): expected to rise to 44.9 from 44.3
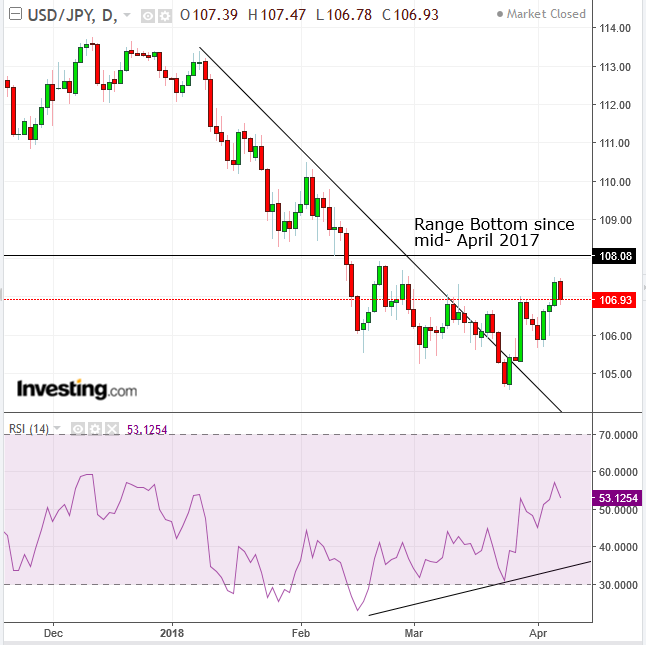
The dollar-yen is showing signs of a bottom. The pair climbed above its uptrend line since January 8; the RSI has been rising, with a positive divergence in March, giving a heads up that price will follow momentum higher. On the downside, the price is approaching the bottom of a range, a resistance area, since mid-April of last year.
21:30: Australia - NAB Business Confidence (March): expected to rise to 12 from 9.
Tuesday
8:30: US – PPI (April): forecast to fall to 0.1% MoM, and core PPI to be 0.2%.
20:30: Australia – Westpac Consumer Sentiment (April): forecast to rise to 103.2 from 103.
21:30: China – CPI (March): YoY rate to drop to 2.6% from 2.9%, and to -0.5% MoM from 1.2%
Wednesday
4:30: UK – Trade Balance (February): forecast to see the deficit fall to £3.4 billion ($4.79 billion).
8:30: US – CPI (March): prices expected to rise 2.3% YoY from 2.2%, and 0.1% from 0.2% MoM. Core CPI to be 2% YoY and 0.2% MoM, from 1.8% and 0.2%.
10:30: US – EIA Crude Inventories (w/e 6 April): stockpile expected to rise by 250,000 barrels, from a 4.6 million barrel drop a week earlier.
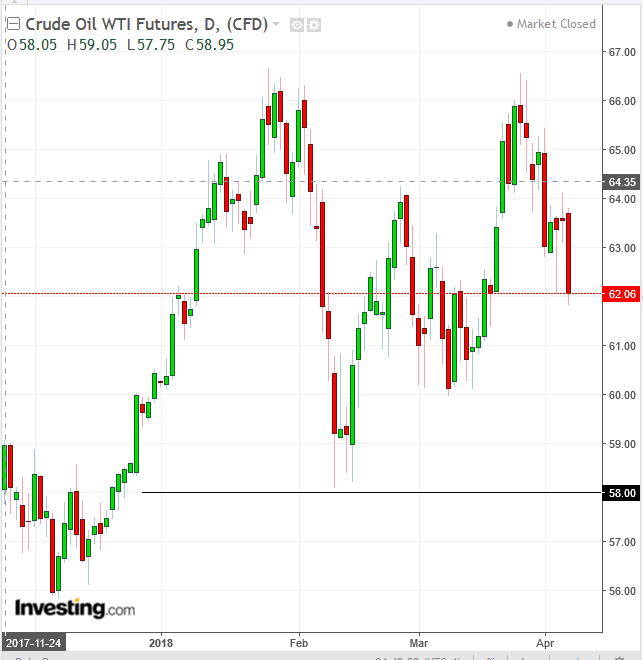
The price of oil has fallen halfway to the $58, February 9 low, increasing the probability of a double top.
14:00: US – FOMC Minutes: the latest increase in interest rates proved that the Fed remains committed to its tightening policy under its new chairman. The minutes should shed further light on the process behind the decision, especially on the threat and significance of a trade war and the latest disappointing NFP read.
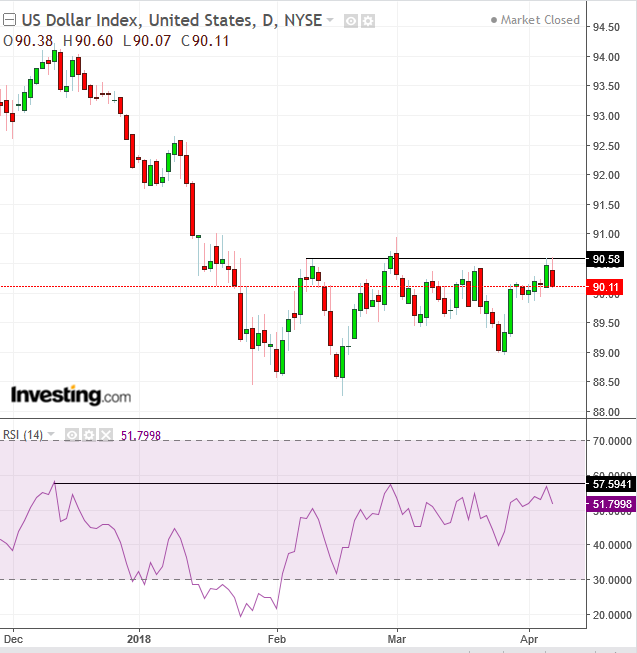
The dollar found resistance at its range top since February. The RSI confirms a resistance to momentum, already since December.
Thursday
5:00: Eurozone – Industrial Production (February): forecast to rise 4.3% YoY from 2.7%.
7:30: Eurozone – ECB Publishes ccount of Monetary Policy Meeting: ECB member Benoit Coeure said Friday that monetary policy will remain loose for some time. Investors will have a chance to see if this opinion is the consensus.
15:00: UK – BOE Governor Carney Speaks: Carney warned Friday of yet another threat to the financial system, the catastrophic impact of climate change. The Governor told banks and insurers they would need to disclose more details about risks they are subject to from climate risks, which could trigger steep losses.When markets are fragile, additional risk-focused rhetoric may add to investor nerves.
23:00: China – Trade Balance (March): surplus expected to fall to $27 billion from $33 billion.
Friday
10:00: US – Michigan Consumer Confidence (April, preliminary): forecast to fall to 100 from 101.4.
