- Best week for US stocks in 5 years
- Gains propelled by weaker dollar, and despite rising yields
- Though lower than levels seen during the selloff, VIX remains high
- Bitcoin falls, first time in 5 days
- A weaker dollar helped support stock prices
- Rising yields, the culprit for the previous selloff, and
- New indictments related to Russian meddling in the 2016 presidential election, which surprisingly didn’t stop stocks from their biggest comeback in half a decade.
- US markets closed for Presidents’ Day Holiday
The Week That Was
US stocks resumed their wild swings, but after the worst two weeks in two years for the major indices, this past week saw the best week for US equities in five years.
Three events propelled the gains:
While stocks pared earlier gains on the newly introduced political risk—and defensive Utilites outperformed on Friday rising 0.89 percent—overall, equities still held on to an advance—the Dow finished the day up 0.08%; the S&P 500 closed higher by 0.04%. While the gains may have been minuscule, the still served to extend the comeback to its sixth day.
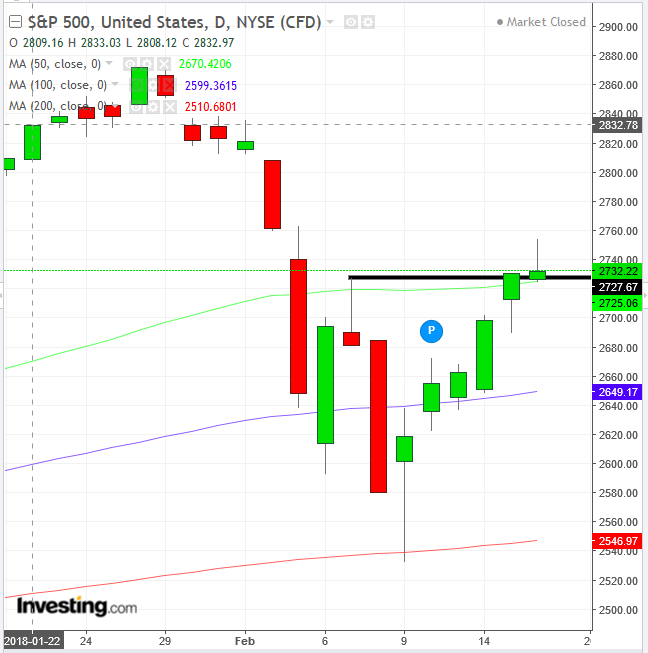
The S&P 500 gained 4.3 percent for the week, with every sector in the green, led by Technology, up 5.75, with Real Estate the laggard, gaining 'only' 1.96 percent. the benchmark index is now just 5.10 percent from its record all-time high, which is also its record close. It has rebounded 7.8 percent since the low of the selloff, which ended on February 7.
On Friday its price crossed back above the 50 dma (green) but the declines brought on by the Russia indictments formed a bearish Shooting Star, whose close, less than 0.2 percent above the February 7 shooting star, may suggest it retains resistance.
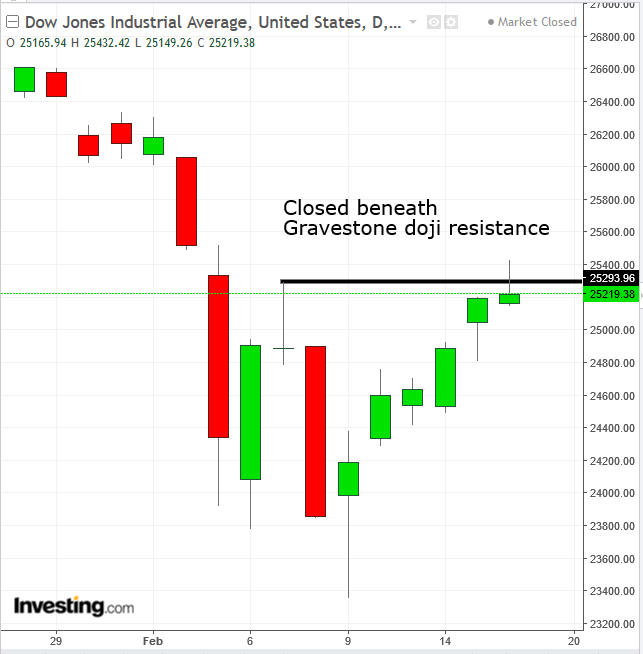
The Dow Jones Industrial Average gained 4.3 percent on the week. It’s now 5.25 percent below its dual high and close records. The mega cap index rebounded 7.9 percent since its February 9 selloff low. Like the S&P 500, it also created a shooting star, after crossing back above the 50 dma (green).
Unlike the S&P 500 though, it is still below the resistance of its February 7 Gravestone doji.
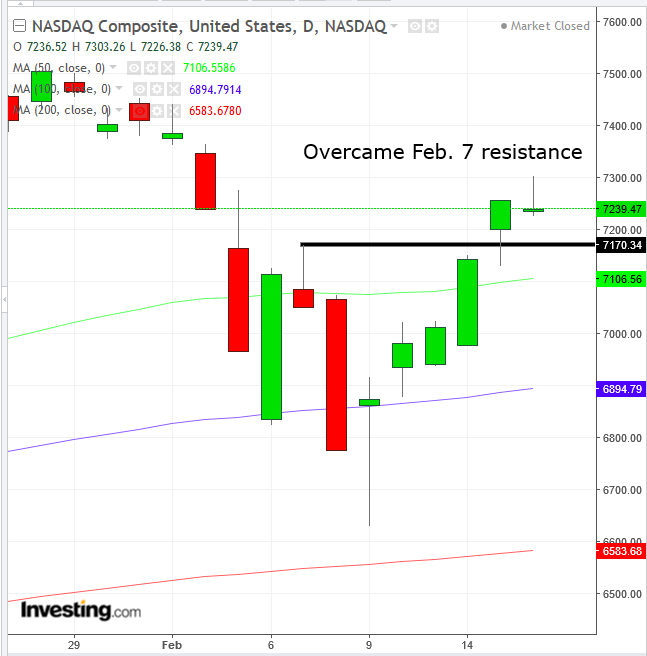
The NASDAQ Composite outperformed on the week, leaping 5.4 percent, though it closed down 0.23% on Friday. The technology heavy index is also the closest to its double record, just 5.05 percent away. It has rebounded 7.15 percent since the lowest point of the selloff, on February 9. It also formed a shooting star but has climbed considerably past its February 7 shooting star resistance, by 1 full percent.
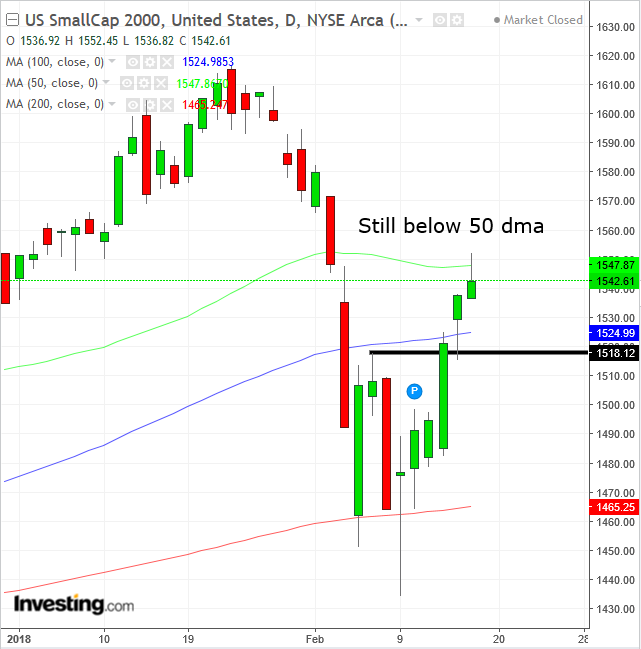
The Russell 2000 small cap index rebounded 4.5 percent for the week, its advance second only to the NASDAQ Composite. It is 4.7 percent beneath its January 24 all-time high and 4.4 percent away from its January 23 record close. It had fallen beneath these records by the time the other major indices posted their double records on January 26. Like the NASDAQ, it formed a shooting star but one that extended even further than its February 7 peak, by 1.65 percent. Also, it did not form a shooting star on that date, as the other indices did. It is the only major US index that failed to climb back above its 50 dma (green).
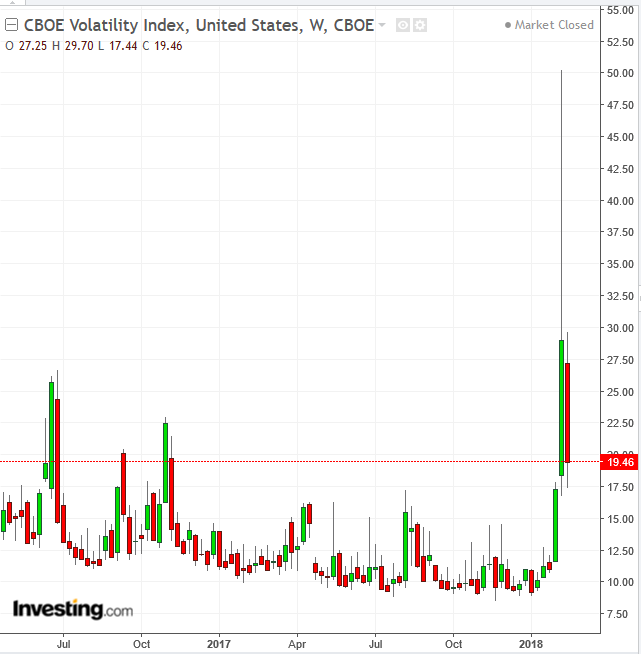
While volatility naturally receded from the VIX's 50.00 high reached during the selloff, and is now much lower, back almost to 20, it is still at the highest level for the index since November 2016, when markets went wild after the surprise results of the US presidential election were released.
Since the start of the selloff, we have maintained that fundamentally nothing has changed. After the knee-jerk reaction to Fed tightening, which investors had convinced themselves wouldn't happen just yet, economic data continued to signal additional traction in synchronized economic growth. As well, 80 percent of the S&P 500 companies that have already reported earnings met or beat expectations, showing an overall average of a 15.2 percent growth YoY. Revenue growth averaged 7.9 percent, the fastest pace since the fourth quarter of 2011.
This clearly demonstrates that economic expansion is supporting profits, just like it always has. Therefore, the panicked selling on economic growth make little sense.
That's not to say that investors should allow themselves to be lulled into complacency again. The amazing recovery is balanced by the potency of the previous selloff. It does not necessarily follow that from here on out we’re back to roaring record-breaking equity rallies.
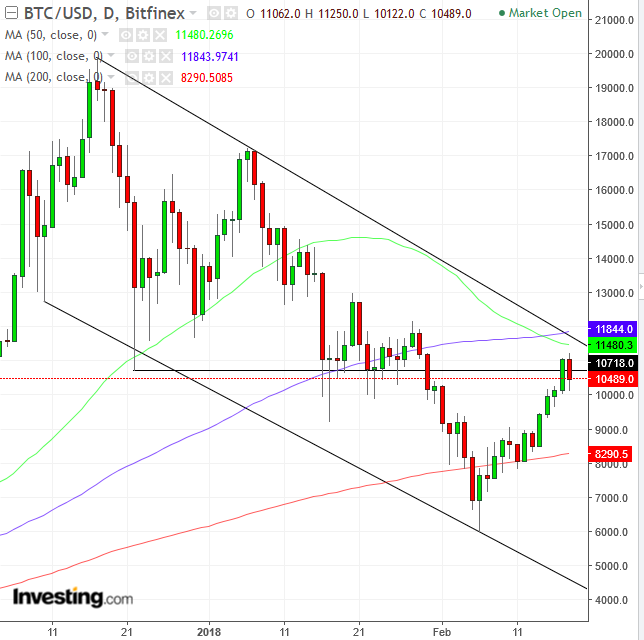
Someone just bought $400 million worth of Bitcoin, paring today's decline. However, it doesn't change the coincidence that the price fell for the first time in 5 days, upon reaching the top of its falling channel.
Another demonstration of the resumption of the downtrend is the 50 dma (green) falling below the 100 dma (blue), signalling that even after the bounce from $600 since February 6, the average of the last couple of months is falling relative to the average of the last half-a-year.
The Week Ahead
All times listed are EST
Monday
Tuesday
02:00: Germany – GfK Consumer Confidence (March): forecast to rise to 11.1 from 11.
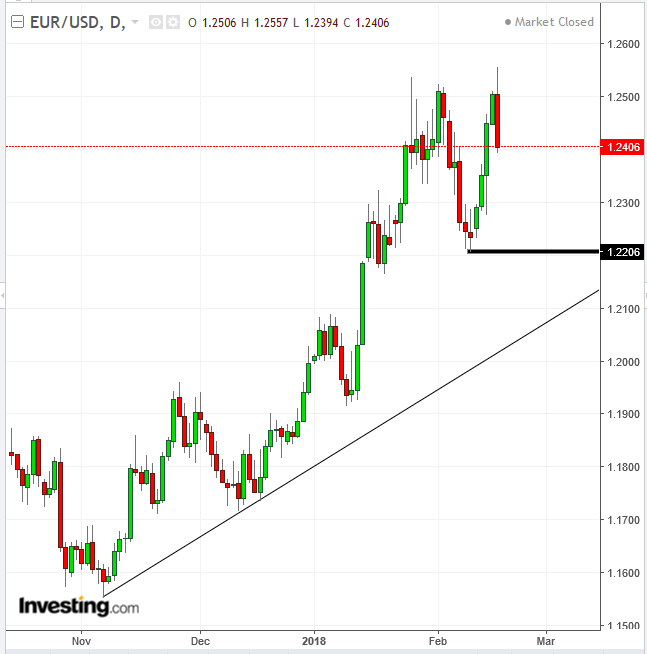
The euro has fallen hard, upon reaching the resistance of its former peak. A break below the 1.2200 level would complete a double bottom, which would coincide with breaking the uptrend line, suggesting a downside move of minimum 300 pips.
05:00: Germany – ZEW Economic Sentiment (February): index forecast to fall to 17.8 from 20.4.
10:00: Eurozone – Consumer Confidence (February, flash): forecast to fall to 0.9 from 1.3.
Wednesday
03:00 – 04:00 French Manufacturing PMI, French Services PMI; German Manufacturing PMI, Services PMI (February, flash): these have been strong performers of late, helping to drive flows into the euro and European stocks. Some weakness is expected but all are expected to remain firmly in expansion territory.
04:30: UK – Employment Data: January claimant count forecast to fall to 5400 from 8600, while the December unemployment rate will hold at 4.3%. Average hourly earnings (including bonus) forecast to rise 2.5% in December, in line with the previous month.
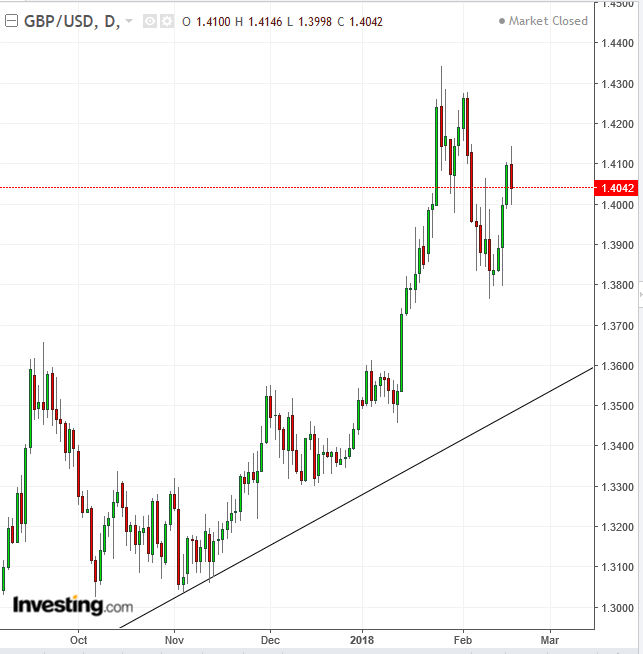
On Friday, the pound fell, upon reaching the resistance of its former peak. A close below 1.38, its former trough, would increase the probability of a downside breakout of the uptrend line since October 2016.
09:45: US – Manufacturing and Services PMIs (February, flash): services reading forecast to rise to 54 from 53.3, while manufacturing expected to weaken to 55 from 55.5.
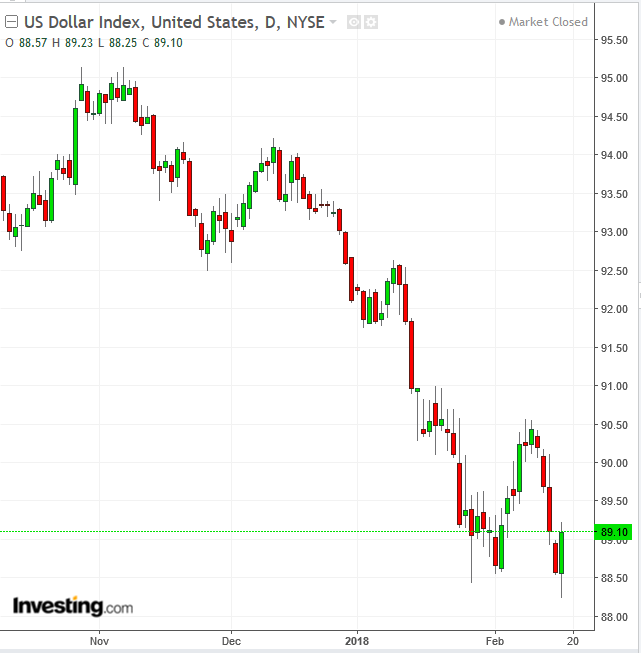
Though the US dollar closed higher on Friday, on support of the preceding, January 26 trough, still, the price registered a lower high of 89.10, extending the existing downtrend.
10:00: US – Existing Home Sales (January): forecast to fall to an annual rate of 5.54 million from 5.57 million.
14:00: US – FOMC Minutes: the inside view of the committee’s deliberations will be interesting, although given the news on inflation since then, the minutes may have less impact. In any case, this account Janet Yellen’s final meeting is not expected to provide any surprises.
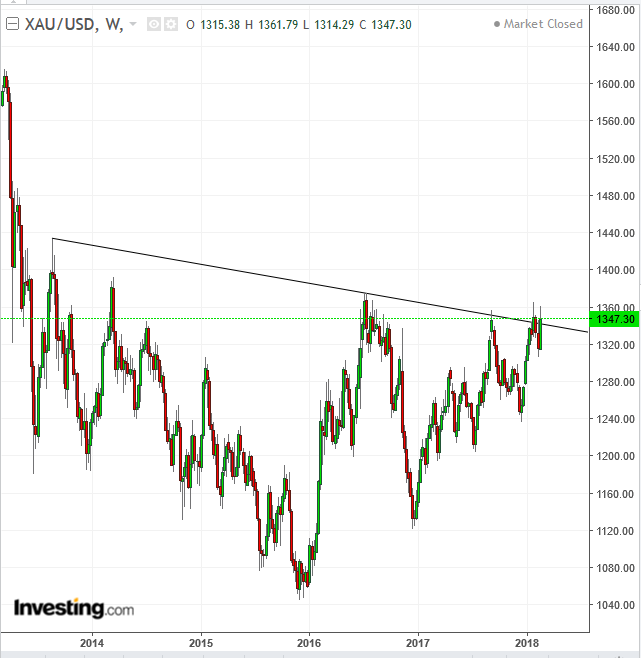
Gold is on the threshold of a massive, 4-and-a-half-year bottom. A close above $1,360 may suggest a $300, long-term up-move.
Thursday
04:00: Germany – IFO Business Climate (February): the index is forecast to fall to 117.4 from 117.6.
04:30: UK – GDP (Q4, 2nd estimate): growth expected to be 0.5% QoQ and 1.5% YoY.
11:00 – US EIA Crude Oil Inventories (w/e 16 February): stockpiles expected to rise by 430,000 barrels.
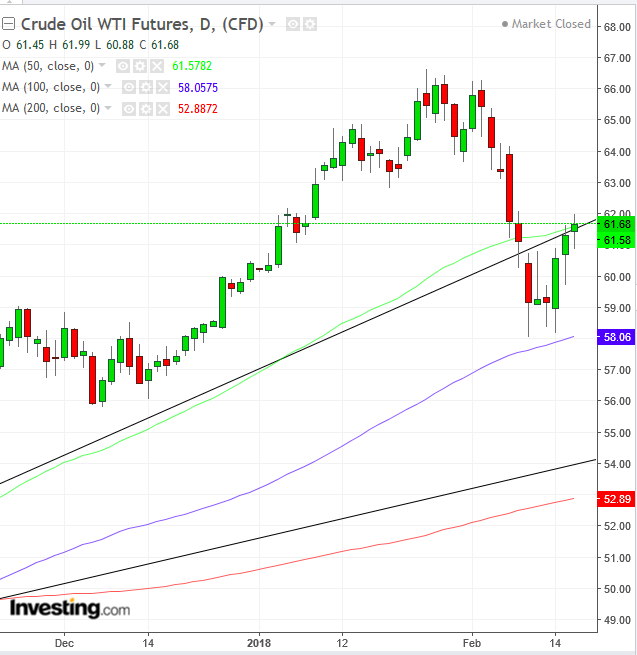
The price of oil on Friday closed right on the 50 dma (green) and the broken uptrend line since August 3, 2017. A close above $62 would consolidate its rebound, while a close beneath $61 may suggest this rally may not last.
18:30: Japan – CPI (January): forecast to accelerate to 1.1% YoY from 1%, while the MoM figure falls to 0.1% from 0.2%.
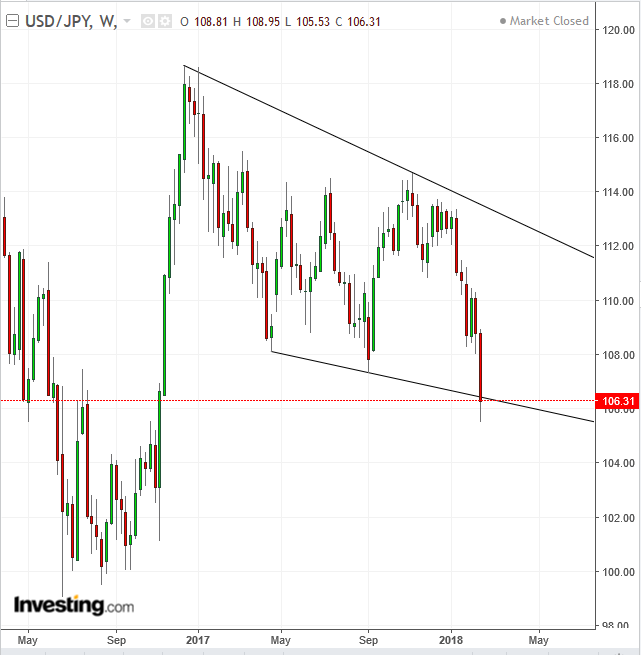
The USD/JPY pair fell below a falling channel, suggesting a harder fall may follow. However, since the price rebounded, when the yen closed with a very small penetration below the channel top, beware of a bear trap. Here's our full analysis.
Friday
05:00: Eurozone – CPI (January): forecast to rise 0.4% MoM.
08:30: Canada – CPI (January): forecast to be 1.9% YoY from 1.9%.
