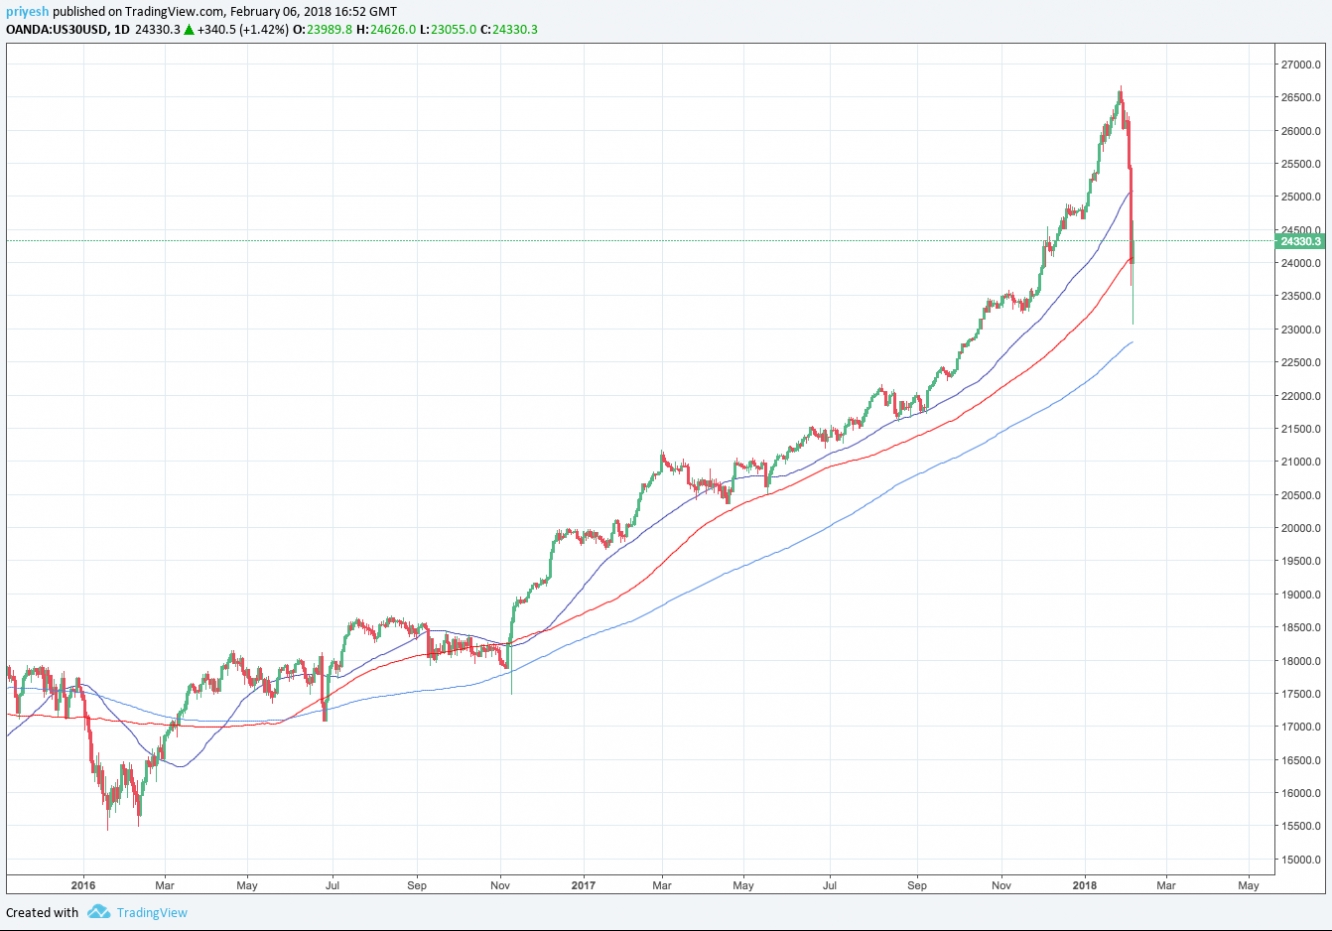
Wall Street - It has been an absolute roller-coaster ride for stocks globally with a massive sell-off after 2 years of solid gains. Wall Street suffered its largest single day points drop in history yesterday, wiping out a total of $4 trillion since last week’s record highs. In this post we are going to take a look at why this drop took place and how traders can predict and trade these events.
The US stock market has been rallying for two years without the type of retracement that would be classified as a correction. A correction is considered to have occurred when a pullback of at least 10% takes place. From the chart, we can see that the Dow Jones index has not had this type of retracement since early 2016.
The beginning of last week saw some panic setting in as fears about inflation kicked in. Inflation has remained at low levels since the global financial crisis, forcing central banks around the world to use extreme, unconventional measures such as quantitative easing to prevent deflation. With inflation at low levels, interest rates have also remained low which means that companies can borrow at a much lower cost. Meanwhile, other pieces of economic data have continued to improve and this has allowed stocks to perform well.
Although, the Fed has been tightening monetary policy, the general consensus among analysts had been that it would be a very slow tightening cycle due to low inflation forecasts. However, this all changed last week. Before entering into 2018, the Fed had said that they expect inflation to improve this year but market participants shrugged this off as we have not seen much improvement in wage data. In addition, major institutions had issued warnings that a correction was due this year. The release of the FOMC minutes last Tuesday then triggered a series of events leading to this sell off.
The Fed left rates unchanged but mentioned that they see inflation reaching their target of 2% “over the medium term.” The general tone of the statement was hawkish and it left the door open to the possibility of a fourth rate hike this year compared to the three that the Fed expect to carry out. Initially, this increased bond yields with the 10-year yield briefly reaching 2.75%. The effect then spilled over into the equity markets. Along with this, Goldman Sachs (NYSE:GS) also issued a warning that they expect a correction in the coming months whilst Bank of America (NYSE:BAC) Merrill Lynch’s Bull & Bear indicator signaled that the markets were “extremely bullish” and a sell off was necessary to bring the indicator back to ‘normal’ territory.
Inflationary fears worsened after Friday’s jobs report with wages experiencing the largest 12 month gain since June 2009. Higher wages means that people will be spending more and demand will increase. Eventually, the demand cannot be met due to supply limits and this causes prices to increase. The fear among traders was that the Fed may have to increase rates at a faster pace than expected previously, leading to higher borrowing costs for companies. Following the NFP report, we saw the Dow slide 600 points before falling a further 1100 points yesterday.
Now that we know why the market has dropped, lets look at how we can trade these type of events. Firstly, although the pullback was predictable, we did not expect such a large drop to occur in one day. To be able to trade events like this, it is important to understand the fundamentals and to regularly read the news.
The first sign off a sell off was the incredible rise of the US stock market along with global stock markets. Both the Dow and S&P 500 indices have formed multiple new highs over the past year. Looking at the chart, we should be able to see that this rate of growth is unsustainable over long periods of time and the market will eventually need to breathe. Secondly, as the number of warnings from institutional traders and analysts increased, we should have expected that sentiment would slowly begin to change. Although it was overdue, the sell-off actually occurred a few weeks earlier than most would have expected but the final trigger should have been the panic that set in on Friday.
Initially, the sell off was just a case of the markets pricing in the possibility of increased inflation and more aggressive policy tightening. As institutions continued to price this in, others began to sell their positions and lock in profits causing a large sell off. As a result, a much larger drop than needed was experienced and this triggered algorithms, adding to these losses. These were the signals we were looking at when we predicted that the markets would continue to panic and drop early into this week.
The Wall Street index is now in the ‘correction’ zone and we expect the bull rally to continue for the remainder of the year. However, this correction has occurred in such a small space of time and so we may see some further losses or slow recovery over the next few weeks. The underlying economic conditions are strong right now and so the fundamental outlook for the remainder of the year is that stocks will continue to gain. It is likely that the growth of the stock market will be at a slower pace than in the last two years and we will slowly approach the ‘bubble’ phase after which we could see a long-term sell off.

