Investors’ appetite rebounded yesterday, and this may have been due to the ECB’s decision to expand its stimulus efforts, as well as due to the relaxation in some capital requirements in the US. Despite still seeing a decent chance for market participants to increase further their risk exposure, given the latest consolidative trading activity, we prefer to sit on the sidelines for now, at least until we get clearer signals that the recovery is set to continue.
MARKET APPETITE REBOUNDS AS ECB EXPANDS STIMULUS
The dollar traded lower against the majority of the other G10 currencies on Thursday and during the Asian morning Friday. It underperformed the most versus SEK, NOK, NZD, and AUDin that order, while it lost the least ground versus CHF, CAD, and JPY. The greenback eked out some gains only against EUR.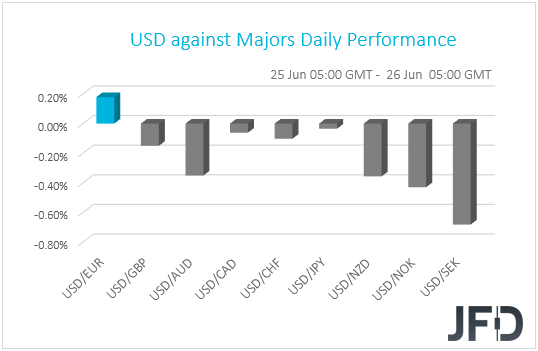
The relative weakness of the safe-havens USD, JPY, and CHF, combined with the strengthening of the risk-linked AUD and NZD, suggests that market sentiment rebounded once again yesterday. Indeed, looking at the performance of global equity markets, we see that major EU and US indices were a sea of green, with the upbeat morale rolling into the Asian trading today. Although Hong Kong’s Hang Seng is down 0.76%, Japan’s Nikkei 225 and South Korea’s KOSPI gained 1.18% and 1.06% respectively.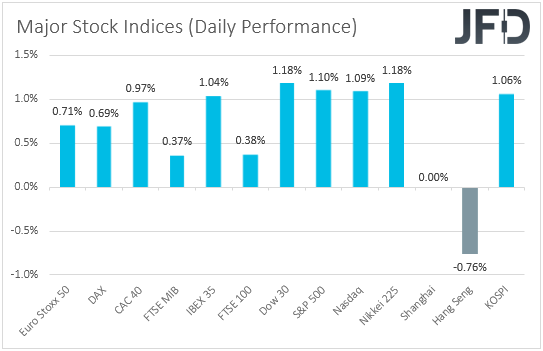
The revival of market optimism may be owed to ECB’s decision to expand its stimulus efforts, as well as the relaxation in some capital requirements in the US that ought to free up cash for lending. The ECB said it would offer EUR loans to central banks outside the Eurozone – which may have also been the reason why the euro was the main loser –, while in the US, banking regulators eased rules covering large banks with complex trading and investment portfolios.
That said, there were also headlines and developments adding to concerns with regards to a second round of coronavirus fast spreading worldwide. Global infected cases continued to accelerate, with the daily number rising to just shy of its record, hit last Friday. On top of that, in response to another surge in infections and hospitalizations in the US, Texas Governor announced he is halting the economic reopening.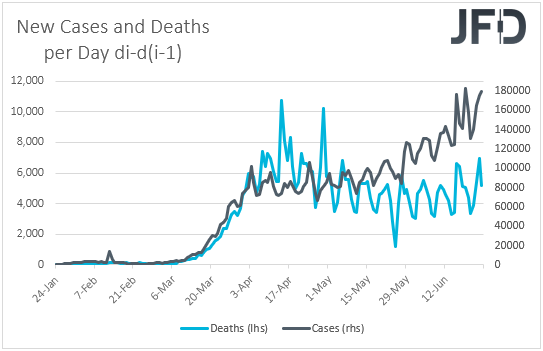
Lately, we’ve been repeatedly saying that, in the financial world, there seems to be a battle between those who believe that an economic recovery could happen faster than previously thought, and those who are concerned over a second wave of fast spreading of the virus, something that could result in a second hit in the global economy. On Wednesday, the latter group seem to have had the upper hand, but yesterday, it was the turn of the first.
We repeat that we belong in the first group and the reason is the lack of willingness around the globe – at least for now – for re-introducing restrictions, something that allows economies to continue to recover. However, bearing in mind the accelerating infections and the neutral technical picture in several stock indices and other sentiment gauges, we will stay sidelined for now. We prefer to wait for clearer signals that the latest risk recovery is set to continue, while in order to start considering the bearish case, we would like to see more lockdown measures being re-introduced worldwide.
S&P 500 – TECHNICAL OUTLOOK
The technical picture on our 4-hour chart suggests that the S&P 500 seems to be trading within somewhat of a broadening triangle formation. Despite declining in the first half of this week, the index reversed higher yesterday and is now showing willingness to move a bit further north. That said, even if the price rises a bit further, we will still aim for those higher areas only within that broadening triangle pattern. Hence our cautiously-bullish approach for now.
A strong move above yesterday’s high, at 3091, would confirm a forthcoming higher high, which may clear the way to the 3118 obstacle, or even the 3139 hurdle, marked by the high of June 24th. The price might stall there for a bit or even correct back down again. That said, if the sellers are still not as confident as the buyers at that time, the S&P 500 could reverse to the upside again and move towards the 3139 zone again, a break of which may clear the way to the upper side of the aforementioned triangle pattern and test the resistance area at 3157, marked near the highs of June 17th and 23rd.
Alternatively, a price-drop back below the 3064 hurdle, marked by yesterday’s intraday swing high, could make the bulls worry, as such a move may increase the chances for the S&P 500 to slide further. The index might then travel towards yesterday’s low, at 3017, a break of which could set the stage for a drop to the 2993 level, marked by an intraday swing high of June 15th.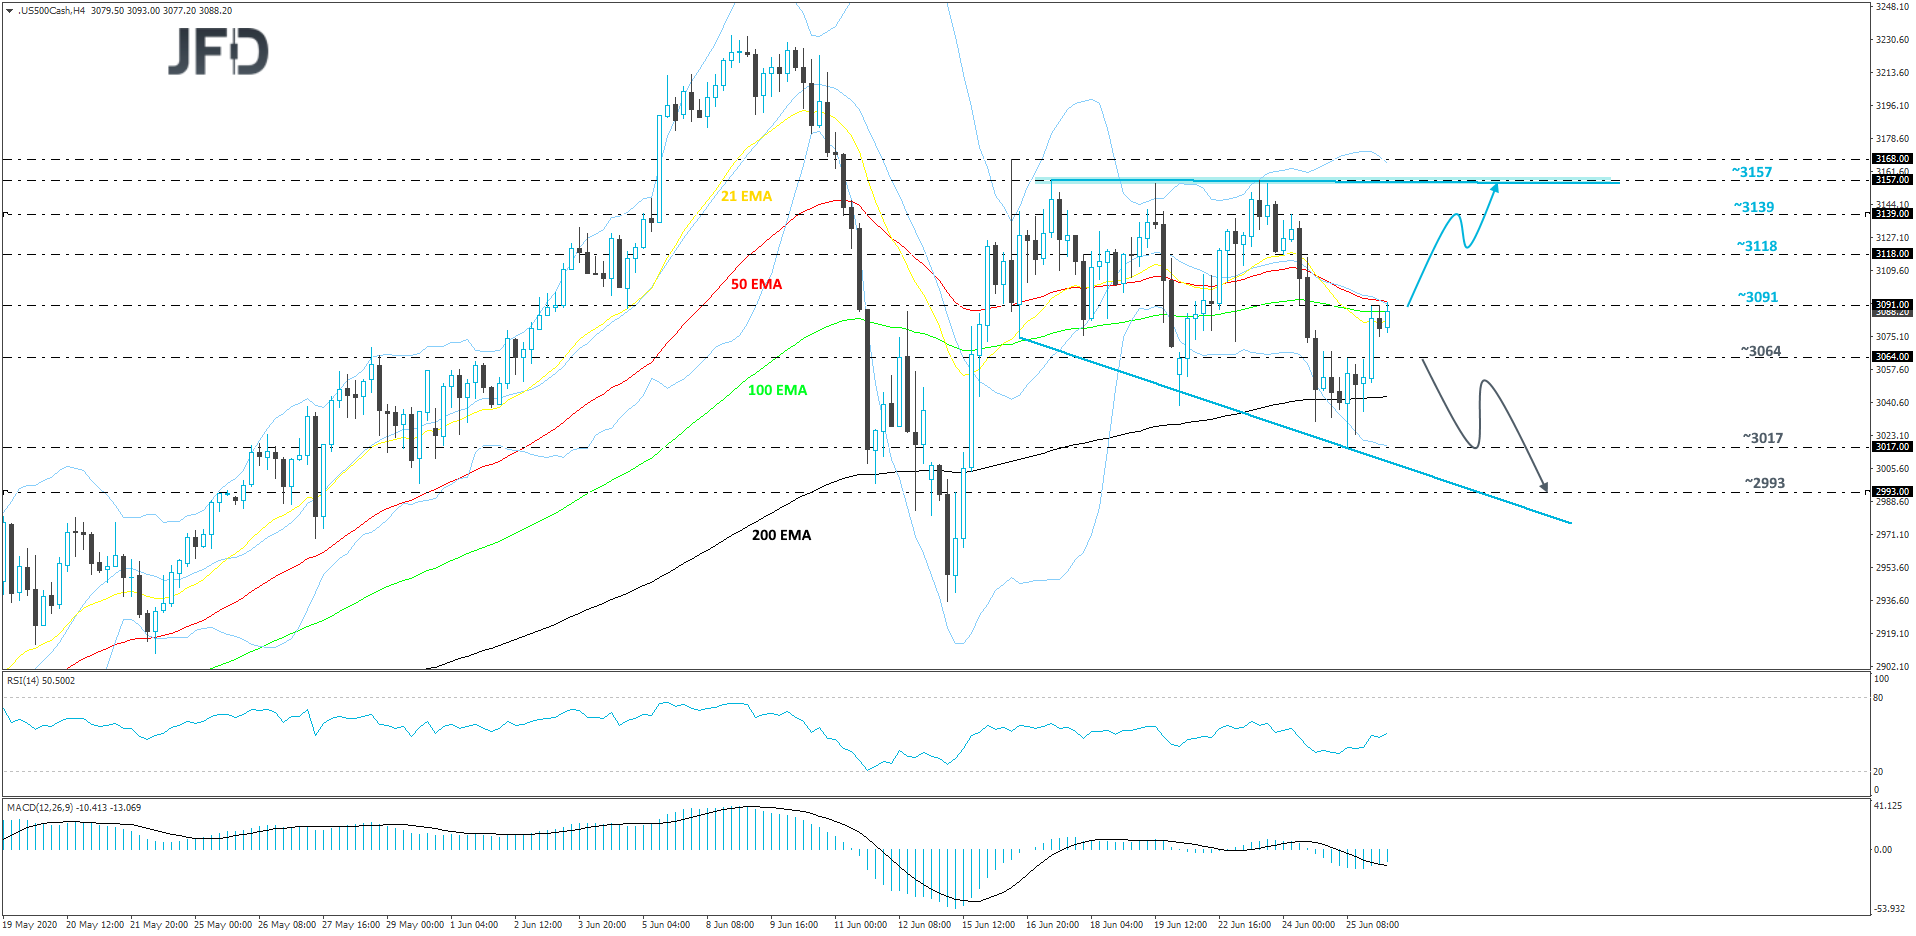
NZD/JPY – TECHNICAL OUTLOOK
From around mid-June, NZD/JPY started moving a bit sideways, but is forming slightly lower highs. At the same time, the pair is struggling to move below its key support area, at 68.20. Looking at our oscillators, the RSI is currently pointing higher, while balancing above 50. The MACD, on the other hand, although it has recently pushed above its trigger line, is still sitting slightly below the zero line. All this puts us in a neutral stance, at least for now.
If, by any chance, NZD/JPY receives a good push from the bulls and gets lifted above a short-term tentative downside line, together with the 69.67 barrier, that may clear the way to some higher areas, as such a move would confirm a forthcoming higher high. The pair could then travel to the psychological 70.00 obstacle, a break of which might open the door for a test of the 70.49 zone, marked by the high of June 10th. Slightly above it lies another possible resistance barrier, at 70.70, marked by the low of June 8th.
Alternatively, if the rate falls below the aforementioned 68.20 hurdle, that would confirm a forthcoming lower low and might also place the pair below the 200 EMA on the 4-hour chart. Such activity may be favourable for the bears, more of whom could step in and drive NZD/JPY further south. The rate could fall to the 67.51 obstacle, a break of which might open the door for another decline, where the next support level may be at 66.87, marked by an intraday swing high of May 29th and an intraday swing low of June 1st.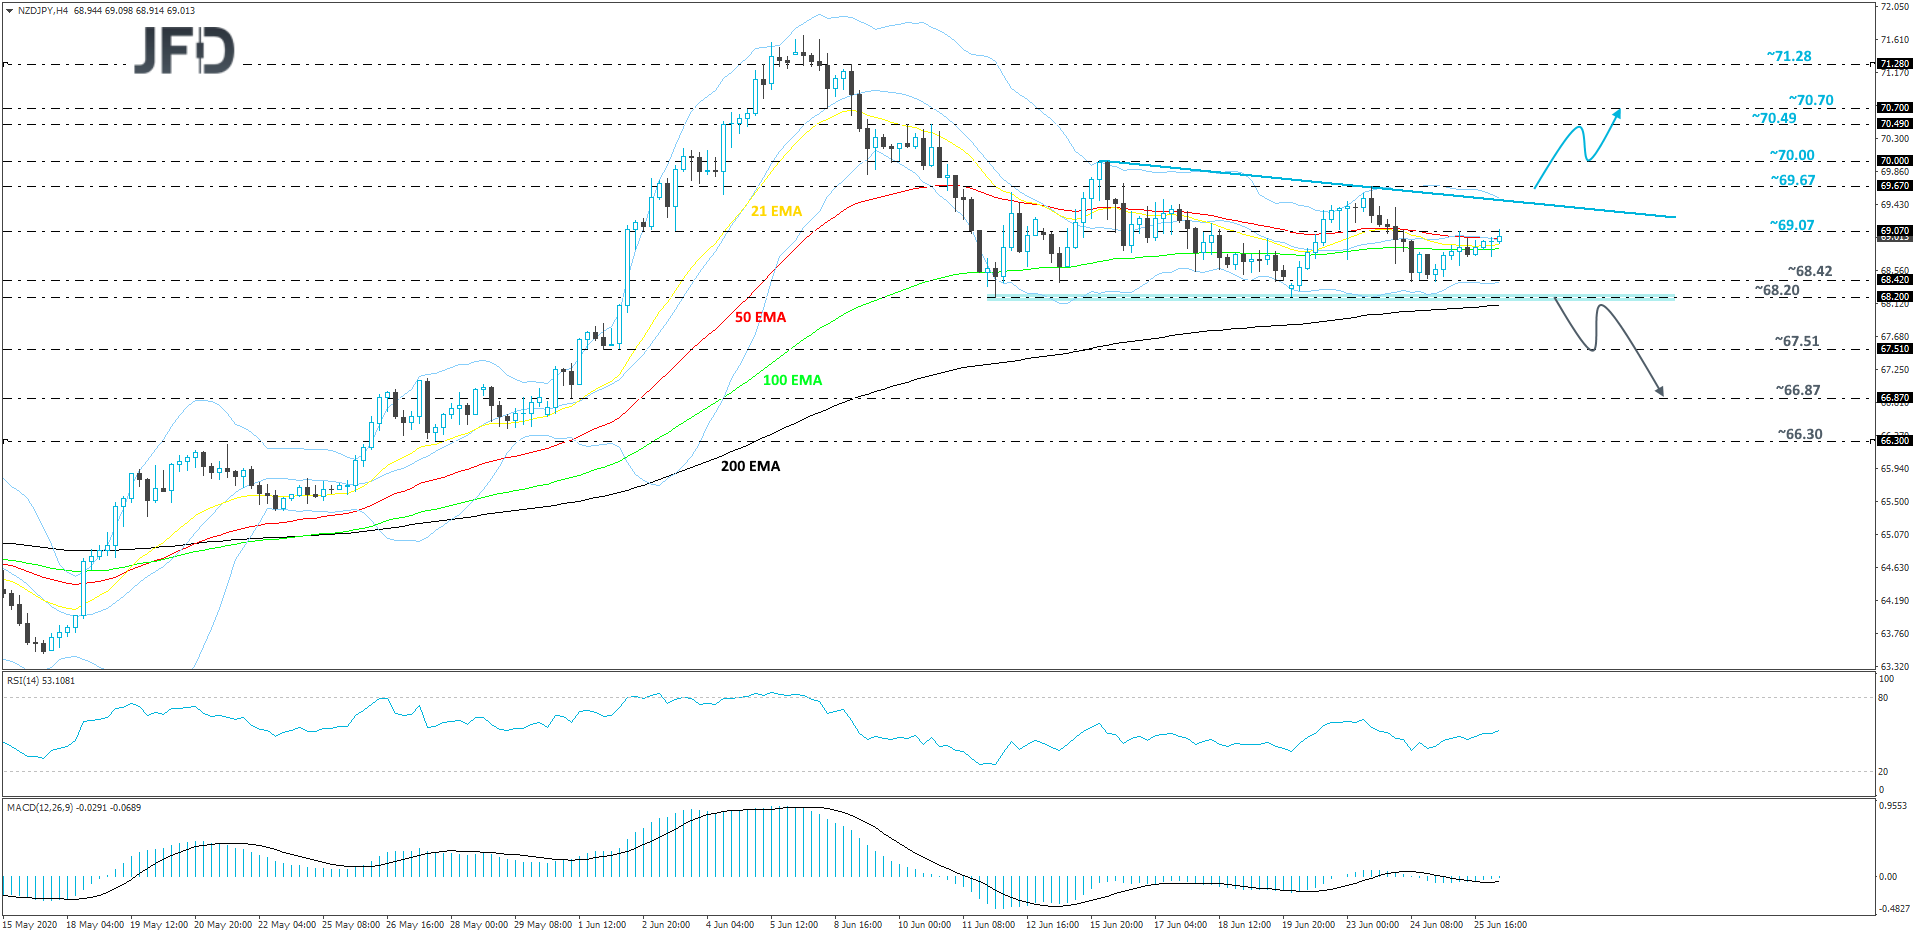
AS FOR TODAY’S EVENTS
Today, the calendar appears relatively light, with the only data set worth mentioning being the US personal income and spending for May, as well as the core PCE index for the month. Personal income is forecast to have slid 6.0% mom after increasing 10.5%, while spending is expected to have risen 9.0% mom after tumbling 13.6%. The case for declining income is supported by the average hourly earnings monthly rate which fell to -1.0% mom from +4.7%, while the strong rebound in retail sales for the month supports the notion for a rebound in spending.
As for the core PCE rate, the Fed’s favorite inflation gauge, it is expected to have slowed to +0.9% yoy from +1.0%. The case for that is supported by the core CPI rate, which slid to +1.2% yoy from +1.4%. The final UoM consumer sentiment index for June is also coming out and the forecast is for a confirmation of the initial estimate, which is at 78.9.
