While there were (and will continue to be) dark days ahead, the 9 November announcement of the highly-effective Pfizer-BioNTech vaccine has apparently marked the beginning of the end of the COVID-19 pandemic.
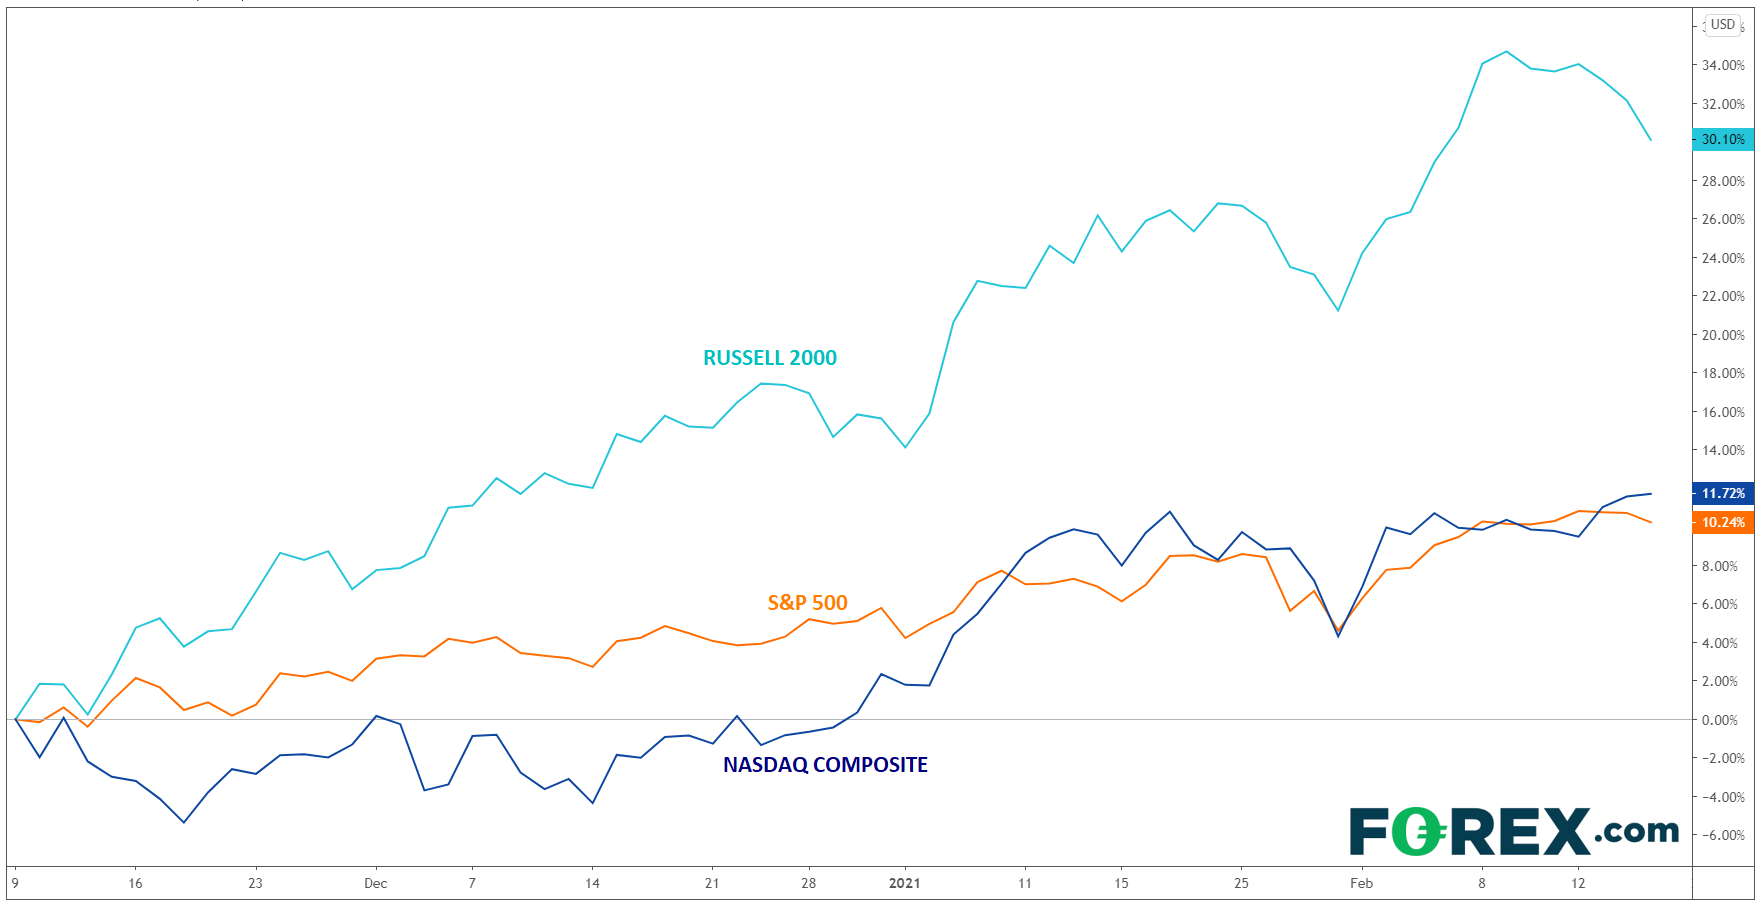
With a few exceptions, vaccine rollout is still frustratingly slow across the globe, but traders immediately recognized the light at the end of the tunnel and started to price in a roaring “reopening” trade the moment the vaccine results were announced. As the chart below shows, the large-capitalization S&P 500 and tech-heavy NASDAQ indices that dominated throughout the pandemic have rallied an impressive 10-12% in the 3+ months since that fateful day, but the 30% surge in the small-cap Russell 2000 index has absolutely dwarfed its larger rivals:

While countless factors have contributed to this impressive move, there are three primary factors driving the Russell’s outperformance:
1. The “reopening trade”
Generally speaking, the stocks that outperformed throughout Q2 and Q3 of 2020 were the primarily technology sector names that enabled both individuals and businesses to adapt to global lockdowns and operate with some semblance of normalcy (think of the usual FANMAG culprits, as well as digital-first companies like Zoom Video (NASDAQ:ZM) and DocuSign (NASDAQ:DOCU)). Now, with multiple effective vaccines in distribution, traders are looking ahead to global consumers returning the “the real world” of brick-and-mortar businesses, which are more often the types of smaller companies that make up the Russell 2000.
2. Potential for easier access to capital
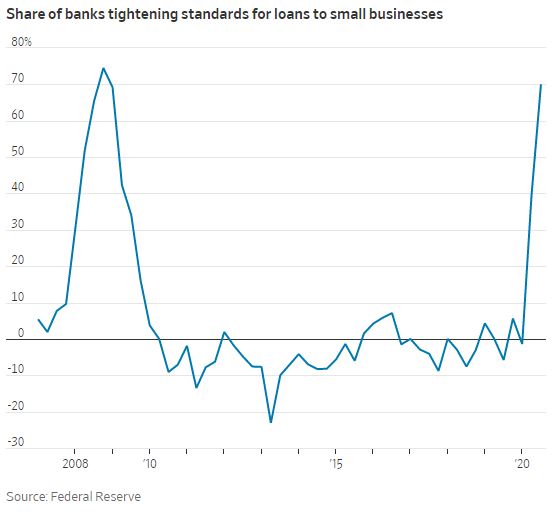
In a distinct but related development, many smaller publicly-traded stocks don’t have the deep banking relationships and access to capital of their large-cap brethren. As banks reined in lending during the pandemic and focused on keeping their highest-value corporate clients intact, smaller companies were at a massive disadvantage, with many unable to raise the funds needed to “bridge the gap” to the a post-COVID environment. The chart below shows that the percentage of banks tightening lending standards on small businesses is on par with the GFC peak in 2009:

As Mark Twain once reportedly said, “A banker is a fellow who lends you his umbrella when the sun is shining, but wants it back the minute it begins to rain.” The ongoing global distribution of vaccines is a sign that the sun might once again be peeking through the clouds.
3. Valuations
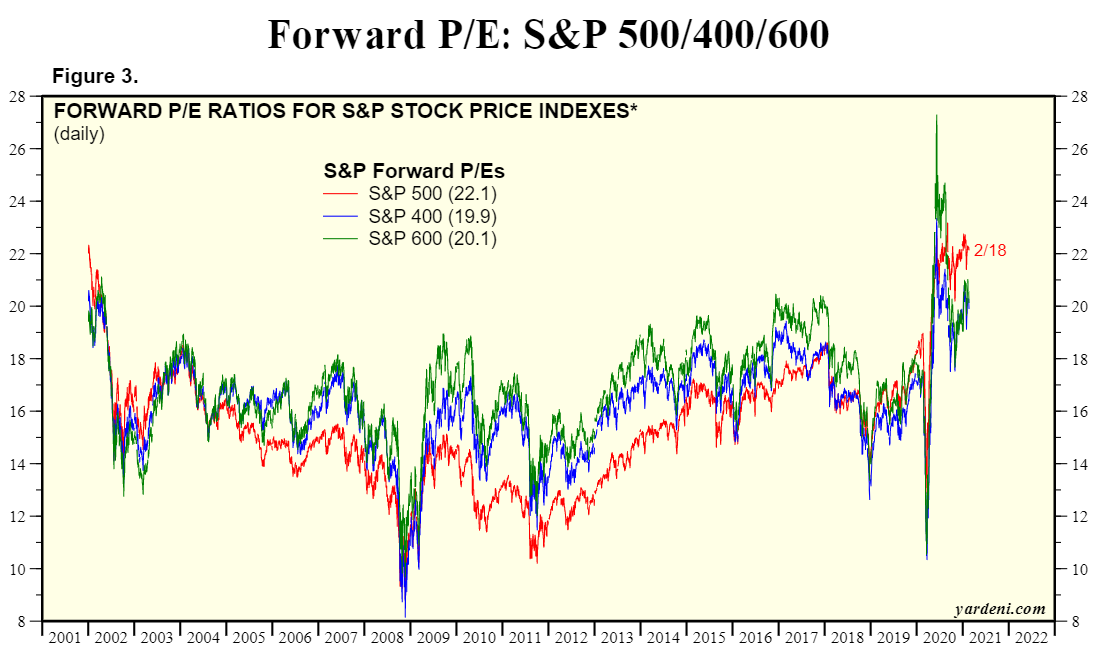
The most basic and straightforward of investment anchors may also be providing a tailwind for small-capitalization stocks. Using the S&P 500 (large-cap), S&P 400 (mid-cap), and S&P 600 (small-cap) as proxies, smaller companies now trade at a meaningful discount to their large-cap rivals for the first time in about 15 years:

After the performance that we’ve seen over the last couple of months, we could see a fourth factor start to contribute to small-cap outperformance moving forward: momentum. Traders have a tendency to buy what’s been outperforming lately, so don’t be surprised if small-cap indices like the Russell 2000 continue to outperform in the coming months.
