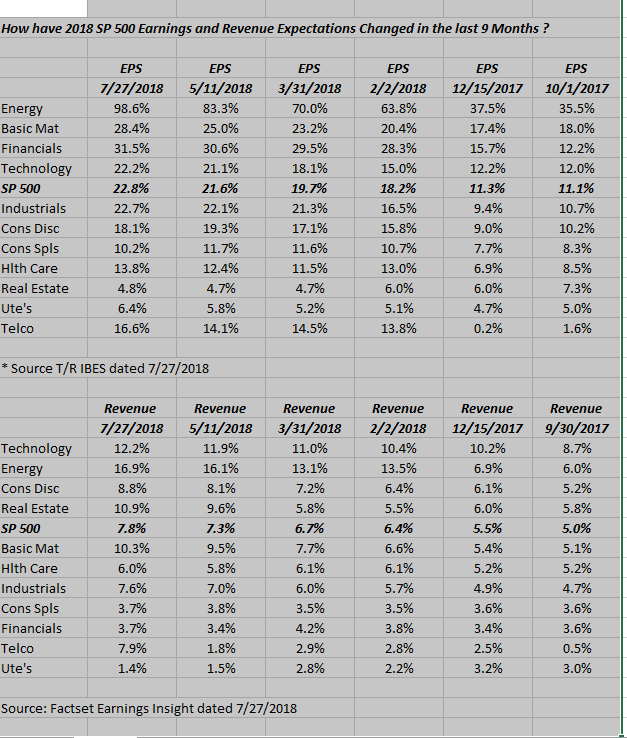
This spreadsheet was posted to this blog in mid-May ’18 as well as late March and mid-February earlier this year to give readers an idea of how full-year 2018 expected growth has tracked by sector.
A couple of points:
1.) Readers can see that the tax reform passage accounted for a substantial part of expected EPS growth in 2018.
2.) Revenue revisions have been quietly positive but still S&P 500 revenue for full-year 2018 has been mid-single-digits or higher.
3.) Energy is showing the strongest expected growth rates of all 11 S&P 500 sectors, but still the sector remains stuck in the mud. Exxon (XOM) and Chevron (CVX) are the biggest companies in the sector and note their action on Friday July 27th after reporting earnings. Exxon looks busted, while Chevron has emerged as the new international, integrated oil leader.
4.) Look at Technology revenue – very little upside. Tech revenue expected growth is just 2% higher than than last December ’17. A lot will depend on what Apple (NASDAQ:AAPL) has to say this week.
5.) Note how Consumer Discretionary and Consumer Staples are the only two lower sectors since the last update on May 11th, in terms of EPS growth.
Analysis / Conclusion: When this weekend’s blog was posted, some thought I was looking for a bear market or substantial slowdown in stock returns, which is a puzzling conclusion. There will be “mean reversion” in terms of EPS growth in the S&P 500 next year, i.e., 2019, but this blog wont start tracking 2019, until 10/1/2018.
Expect EPS growth for the S&P 500 to return to 10% – 11% in 2019, which would be perfectly consistent with historical returns, even slightly better. Readers can see how from March 31, 2018, onward this year, the year-over-year growth gets progressively smaller, which is normal given the tax reform effects.
