Thursday December 1: Five things the markets are talking about
In November, Trump’s surprise U.S presidential win was a boon for the mighty dollar via the markets “reflation” trade hopes.
Can the ‘big’ dollar gains be added to this month or has the market overshot the mark in their enthusiasm?
The death of a deal is always in the details -Trump’s administration has shed little specifics into his infrastructure spending plans. His much touted +$1T plan in reality is probably much smaller – the market seems to be relying heavily on “assumptions” about private sector involvement via tax credits.
With a Fed rate hike fully priced in for Dec 14, the market is prime to see a repeat of last December hike where investors ended up “buying the rumour and selling the fact.”
For today, expect the market to somewhat consolidate ahead of tomorrow’s non farm payroll report (NFP).
1. Global stocks mixed
Stock markets have got off to mixed start in the final month of the year, as investors remain cautious ahead of this weekend’s Euro political events and next week’s ECB meet.
Asian shares gained overnight on the back of crude prices jumping more than +8% yesterday. Australia’s S&P ASX 200 closed up +1.1%, while Japan’s Nikkei Stock Average also rose +1.1% to close at its highest level of the year.
In Europe, equity indices are trading lower across the board as political uncertainty in Italy continues to weigh on market sentiment despite a positive rise in oil prices. Energy, commodity and mining stocks are providing the FTSE 100 support, while financials continue to be a drag on the Stoxx 600.
U.S stock futures are set to open small down -0.2%.
Indices: Stoxx50 -0.6% at 3,033, FTSE -0.6% at 6,742, DAX -0.6% at 10,578, CAC 40 -0.4% at 4,558, IBEX 35 -0.4% at 8,654, FTSE MIB -0.3% at 16,873, SMI -0.9% at 7,802, S&P 500 Futures -0.2%

2. Crude off its highs, metals mixed
OPEC surprised cynics yesterday by agreeing to a targeted production cut that comes at the lower end of the pre-Vienna discussed ranges.
The details show that members agreed to implement -1.2m bpd in cuts to +32.5M.
Iran is allowed to increase its production to +3.975m bpd (as expected). Both Nigeria and Libya are exempt from the production deal (as expected). The Saudi’s are to cut by -486k bpd, while Iraq is to cut by -210k bpd, Qatar by -30k bpd, UAE by -139k bpd and Venezuela to cut -95k bpd.
Russia’s Energy Minister Novak confirmed that they are to cut their own output by up to -300k bpd only gradually due to technical issues and are committed to the deal if OPEC respects its part. The deal commences Jan 1, 2017 for at least six-months.
The announcement saw crude oil prices jump to above the psychological +$50 a barrel, however, prices have since backed off from their highs as traders consider the agreement may only draw more supplies from storage tanks and more crude shipments from the U.S and not have a material impact on global glut concerns.
Brent crude futures have soared +$4 overnight to +$52.73 a barrel, while WTI light crude have added to yesterday’s gains of +9% to reach +$50.00 a barrel for the first time in six-weeks.
In other commodities, spot gold has slipped -0.3% to +$1,167.64, its lowest level since Feb. Zinc has gained +0.6%, while copper fell -0.8% – note: Nov was the best month in six-years for industrial metals.

3. Bonds loses -$2T in November
Last month is considered “fait complete” for the three-decade bond rally.
Investors have pulled more than +$11B from U.S. bond funds since Trump’s victory on the markets “reflation” trade. U.S. 10-Year yields have climbed +56bps to +2.38% in November, the biggest monthly jump in seven-years.
With the Fed expected to start raising interest rates in a couple of weeks (Dec 14), and fed fund future pricing in more than one hike a year, has market inflationary expectations climbing. If you include the fact that some Tier 1 central banks are considering buying fewer sovereign securities going forward, sovereign yields can only do one thing and that’s back up and steepen even further. Market expects U.S 10’s to trade towards their 14-month highs north f +3.04%
Rising sovereign yields make it very difficult for the ECB’s QE program. Euro policy makers next meet on Dec 8 with the market expecting Draghi to extend the program beyond March 2017.

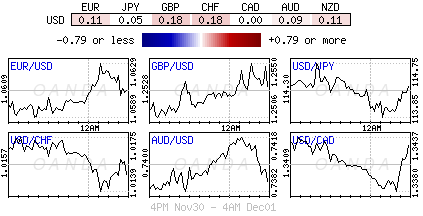
4. Dollar off its highs but remains strong
Ahead of the U.S open, US Dollar Index is down -0.2%, after closing at its second highest level of the year yesterday, nevertheless, rate differentials continue to support the USD.
USD/JPY has erased some of its earlier overnight gains, falling to ¥113.86 from ¥114.83. The pound has dipped (£1.2513) after this morning’s U.K. manufacturing PMI came at +53.4 in November, below consensus. The EUR continues to remain range bound, trading north of €1.06 at €1.0627.
Note: Investors are paying up (one week implied vols.) the most since Brexit to protect against EUR price swings ahead of this weekend’s Italian referendum and Austria’s Presidential election (Dec 4) and next weeks ECB meeting (Dec. 8).
5. Eurozone manufacturing PMI’s unrevised
The manufacturing PMI’s for the eurozone was unrevised last month (+53.7), and up slightly from October (+53.5), which suggest that Europe’s modest recovery may be gaining some momentum.
What should please the ECB is that there are some signs of rising inflationary pressures. Regional manufacturers are increasing their prices at the fastest pace in five-years, partly in response to rising oil and raw materials costs.
Nevertheless, the ECB remains likely to extend its QE program next week, but has to now be considering a reduction in its monthly purchases over time. However, this Sunday’s Italian referendum could throw a spanner in the works.
Other European data this morning showed that the Eurozone unemployment rate fell last month (+9.8% vs. +9.9%) to print a new five-year low.