
President Trump completed his first 100 days in office on April 29. And while the progress on his agenda has been slow so far, stock market investors have plenty of reasons to be happy. Stocks continue to fly high despite rising policy uncertainty even though the strong momentum for “Trump trade” seen after the election has dissipated.
With improving corporate earnings and low interest rates, investors continue to believe that stocks could rise further. Let’s take a look at winners and losers in major areas of the market during Trump’s first 100 days in office. (Read: ETF Winners and Losers of April 2017)
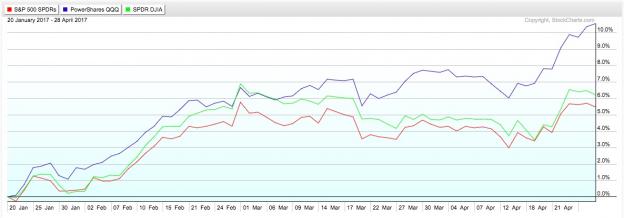
Broad Market Indexes: The S&P 500, Dow and Nasdaq
The major broad market indexes ended the month of April near their all-time highs, thanks mainly to better-than-expected earnings. The tech heavy Nasdaq index crossed 6,000 with many tech titans surging to their record highs.
Looking at the performance over the past 100 days, the SPDR S&P 500 ETF (NYSE:SPY) (SPY) has risen about 5.5% and the SPDR Dow Jones Industrial Average (SI:SPDR) ETF (DIA) is up about 6%. This is on top of similar gains between the election and inauguration.
The PowerShares QQQ ETF (QQQ), which tracks the Nasdaq 100 index, is the biggest winner with gains exceeding 10% in the past 100 days.
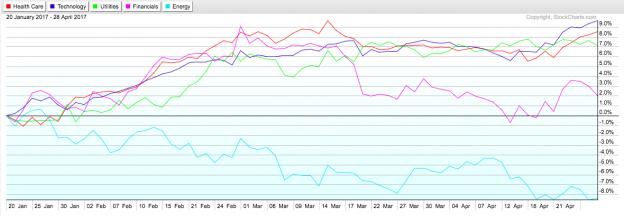
Major Sectors: Winners & Losers
Healthcare and Technology are the best performers over the past 100 days, while energy is the worst. The SPDR Technology Select Sector SPDR Fund (XLK) and the SPDR Health Care Select Sector (MX:XLV) SPDR Fund (XLV) are up about 9% and 8% respectively.
While improving earnings and repatriation tax holiday plans have led to the surge in tech stocks, healthcare stocks have managed to hold on to their gains despite policy uncertainty, thanks mainly to attractive valuations after last year’s underperformance. (Read: Technology ETFs Set to Rally on Q1 Earnings)
The SPDR Utilities Select Sector (MX:XLU) SPDR Fund (XLU) has been an unexpected winner—up about 6%--thanks mainly to the surprising fall in rates. The SPDR Energy ETF (NYSE:XLE) (XLE) is the worst performer, down about 9%, mainly due the fall in oil prices.
After a surge late last year, financial stocks represented by the SPDR Financial Select Sector SPDR Fund (XLF), lost their shine this year on expectations that the Fed will be not able to raise rates as swiftly as earlier anticipated.
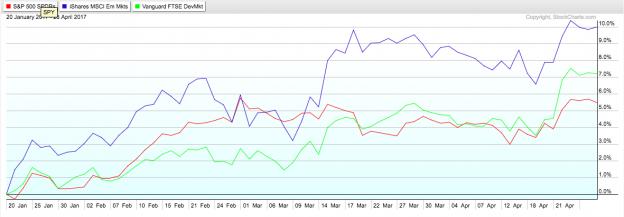
International Markets Outperforming
As the US stocks lost some momentum this year, after a strong rally post-election, international markets have been doing really well, thanks mainly to strong pick up in economic growth in many parts of the world.
The Vanguard MSCI EAFE ETF (VEA), which holds a diversified group of stocks from developed markets excluding US, is up about 7% and the iShares Emerging Markets ETF (EEM) is up 10%, outpacing S&P 500’s 5% gain. (Read: How to trade “Sell in May and Go Away with ETFs)
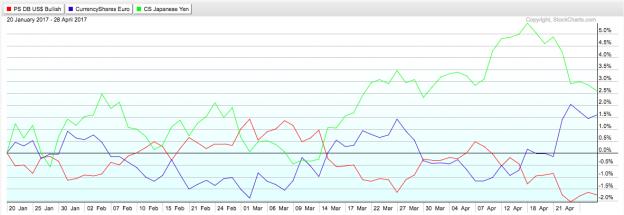
Major Currencies: The US Dollar, Euro and Yen
While the US dollar had surged after the election in anticipation of strong economic growth and higher interest rates, the rally has petered out this year. Lackluster economic growth in the US, cautious tone from the US as well as Trump’s comments that the dollar was too strong, led to greenback’s underperformance against other major currencies.
During this period, the Japanese yen has appreciated thanks to rising geopolitical concerns. Improving Europe economy and receding political risks have led to euro’s gains.
The PowerShares DB US Dollar Bullish Fund (UUP) is down about 2.2%, while the Guggenheim CurrencyShares Japanese Yen Trust (FXY) is up 2.5% and the Guggenheim CurrencyShares Euro Trust (FXE) is up 1.5%.
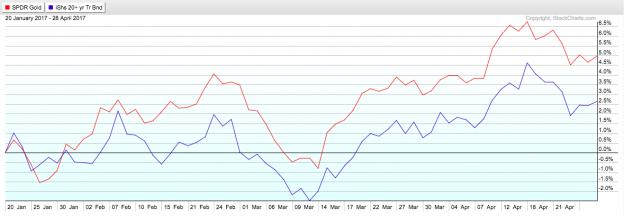
Safe Havens: Treasury Bonds and Gold
Bond bears will have to wait! The 35-year-old bond rally did not end after the election, as widely anticipated. Rising geopolitical risks, decline in interest rates and heavy bond purchases by other major central banks drove Treasury yields lower.
The IShares Barclays (LON:BARC) 20+ Year Treasury Bond Fund (TLT) is up about 2.5% and the SPDR Gold ETF (NYSE:GLD) is shining bright with a 5% gain as many investors piled into the safety of gold with rising geopolitical uncertainty.
Where Do Zacks' Investment Ideas Come From?
You are welcome to download the full, up-to-the-minute list of 220 Zacks Rank #1 "Strong Buy" stocks free of charge. There is no better place to start your own stock search. Plus you can access the full list of must-avoid Zacks Rank #5 "Strong Sells" and other private research. See the stocks free >>
ISHARS-20+YTB (TLT): ETF Research Reports
SPDR-TECH SELS (XLK): ETF Research Reports
SPDR-DJ IND AVG (DIA): ETF Research Reports
CRYSHS-JAP YEN (FXY): ETF Research Reports
NASDAQ-100 SHRS (QQQ): ETF Research Reports
SPDR-GOLD TRUST (GLD): ETF Research Reports
SPDR-SP 500 TR (SPY): ETF Research Reports
PWRSH-DB US$ BU (UUP): ETF Research Reports
ISHARS-EMG MKT (EEM): ETF Research Reports
SPDR-HLTH CR (XLV): ETF Research Reports
SPDR-FINL SELS (XLF): ETF Research Reports
SPDR-CONS DISCR (XLY): ETF Research Reports
SPDR-EGY SELS (XLE): ETF Research Reports
VANGD-FTSE DV M (VEA): ETF Research Reports
Original post
Zacks Investment Research