Trading Ranges Remain As Indices Start To Coil

Published 10/10/2019, 12:43 AM
Updated 07/09/2023, 06:31 AM

Markets are forming small pennants/coils as last week's losses shape into a set of inside days. For indices testing 200-day MAs, the reaction bounce has now stalled as markets search for the next move.
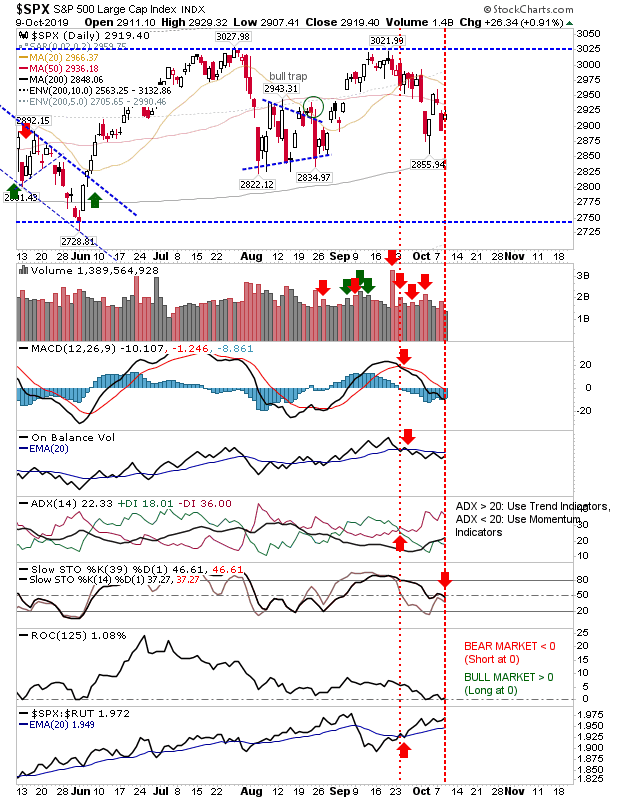
SPX Daily Chart

In the case of the S&P, yesterday's reaction to the bounce has been somewhat disappointing with an inside day which failed in its attempt to challenge overhead 50-day MA resistance. Technicals have also moved into net bearish territory. It looks like the next move is down, but a close above the 50-day MA would likely be enough to see a challenge on 3,025.

The NASDAQ is also coiling to a point where yesterday's doji sets up a possible swing trade opportunity—trade a break of the respective highs/lows and place a stop on the flip side. Based on bearish net technicals and the series of distribution days since the last consolidation breakout, the favored outlook is a new move lower, which would make 7,300 the next target down.
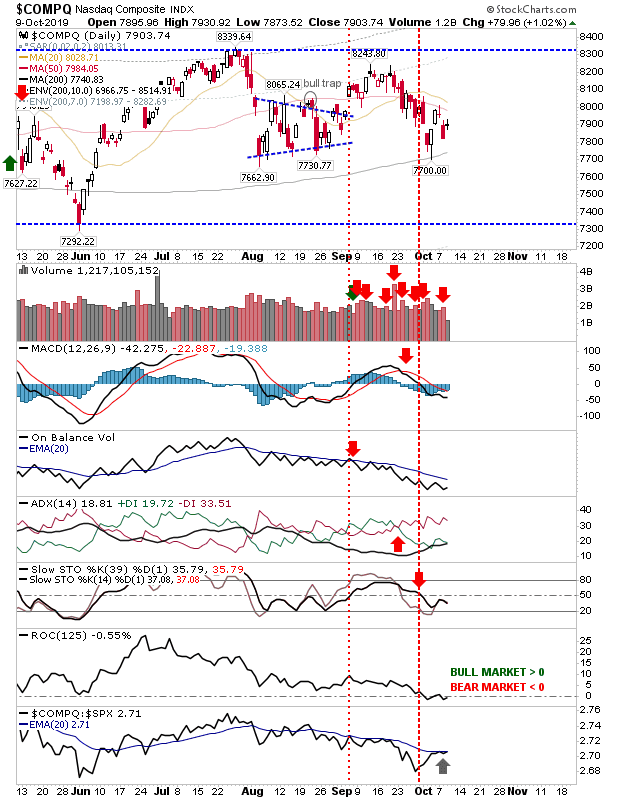
COMPQ Daily Chart
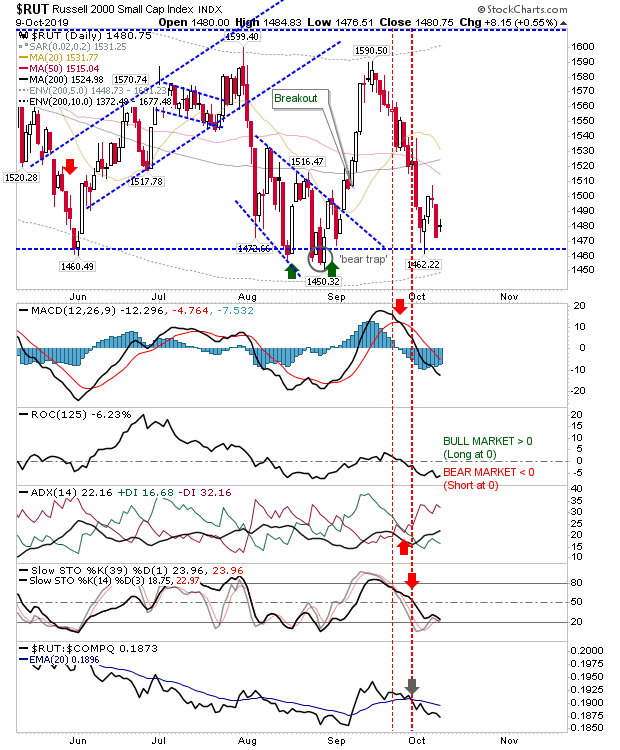
RUT Daily Chart

For the Russell 2000 this spells more trouble. The only potential saving grace was yesterday's doji, which could rank as a bullish harami cross—which if true—should see higher prices today. However, it could be the spreading weakness in Large Caps and Tech Indices which ultimately brings this down. Indicators are not yet oversold.
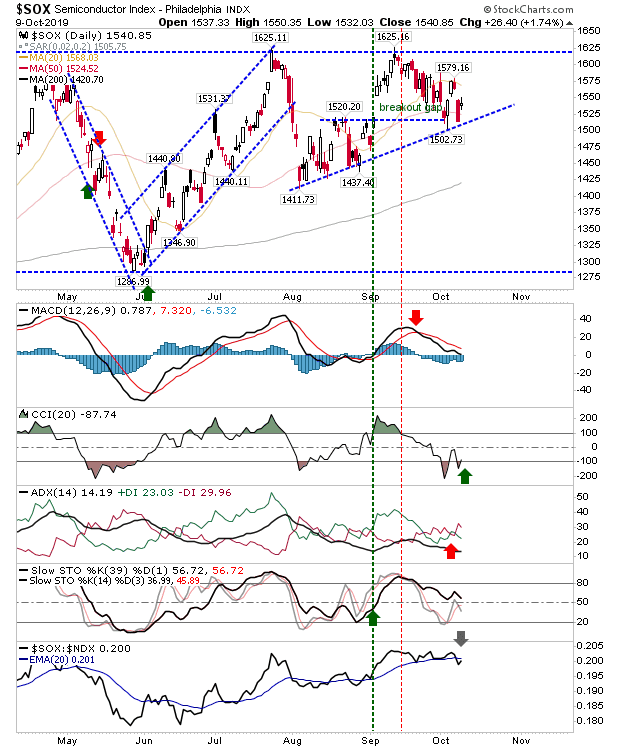
SOX Daily Chart

The Semiconductor Index closed the breakout gap earlier last week and now is caught in a bit of a no-mans land. Rising support has held, but for how long after five tags of support? Technicals are mixed, so no one side has an advantage over the other. It remains to be seen how the Semiconductor Index and NASDAQ can influence one another.

For today, it will likely be up to the Russell 2000 to determine which way other indices will go. Expectations are for lower prices based on supporting technicals, but if 50-day MAs can be cleared by the NASDAQ and S&P it would give a solid basis for a return challenge on 52-week highs.

Latest comments

Loading next article…
Risk Disclosure: Trading in financial instruments and/or cryptocurrencies involves high risks including the risk of losing some, or all, of your investment amount, and may not be suitable for all investors. Prices of cryptocurrencies are extremely volatile and may be affected by external factors such as financial, regulatory or political events. Trading on margin increases the financial risks.
Before deciding to trade in financial instrument or cryptocurrencies you should be fully informed of the risks and costs associated with trading the financial markets, carefully consider your investment objectives, level of experience, and risk appetite, and seek professional advice where needed.
Fusion Media would like to remind you that the data contained in this website is not necessarily real-time nor accurate. The data and prices on the website are not necessarily provided by any market or exchange, but may be provided by market makers, and so prices may not be accurate and may differ from the actual price at any given market, meaning prices are indicative and not appropriate for trading purposes. Fusion Media and any provider of the data contained in this website will not accept liability for any loss or damage as a result of your trading, or your reliance on the information contained within this website.
It is prohibited to use, store, reproduce, display, modify, transmit or distribute the data contained in this website without the explicit prior written permission of Fusion Media and/or the data provider. All intellectual property rights are reserved by the providers and/or the exchange providing the data contained in this website.
Fusion Media may be compensated by the advertisers that appear on the website, based on your interaction with the advertisements or advertisers.
© 2007-2025 - Fusion Media Limited. All Rights Reserved.