The Hoot
Actionable ideas for the busy trader delivered daily right up front
- Thursday higher only if ES stays above its new pivot, else lower.
- ES pivot 2063.00. Holding above is bullish.
- Friday bias uncertain technically.
- Monthly outlook: bias lower.
- Single stock trader: N:VZ not a swing trade buy
Recap
| Hey Mikey! He likes it! |
I had a bad feeling about Wednesday. After all, all year long it was clear that Mr. Market hates everything. But then right at 2 PM Auntie Janet served up some of her tasty Interest Rate Surprise and it was like, hey Mikey! He likes it! With the Dow up 1.28%, the SPX up 1.45% and the Nasdaq up 1.52%, it was a sea of green on the Street as the Night Owl had her best day of the year so far. Yum! There were some interesting charts to be sure but now we have to ask, will Mr. Market have a sugar crash on Thursday or will he be hankering for another helping of Feds. Let's check the charts to find out.
Let me also add that with Christmas coming next week, the Night Owl is planning to take the entire week off. With a holiday-shortened week and after all the excitement this week, I'm sure a lot of traders will be ready for a vacation.
The Dow: Looking at it from a purely technical point of view on Monday, we got a nice hammer on the Dow, which was confirmed on Tuesday. And on Wednesday, we got the payoff in the form of a tall green marubozu good for a 2.24 point pop that took the Dow straight through its 200-day MA. That left indicators only barely off of oversold with a long way to go before hitting overbought. So with a new rising RTC established with three up days in a row (something haven't seen in since the end of September), this chart looks flat-out bullish for Thursday.
The VIX: On Monday, the VIX traded almost entirely above its 200 day MA by putting in a fat red spinning top. That was confirmed on Tuesday with a small gap-down spinning top that completed a bearish evening star. And that in turn was confirmed on Wednesday with another gap-down spinning top, this one red that resulted in a nearly 15% decline.. That leaves the VIX just above its 200 day MA at 16.51 with falling indicators and a completed bearish stochastic corssover. And there's no reason to believe that it won't try to touch that level on Thursday.
 |
| ES daily |
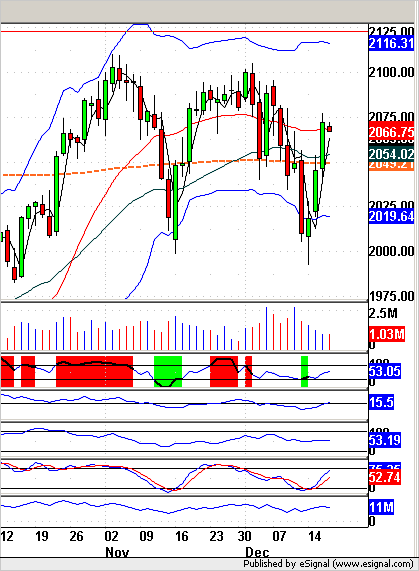
Market index futures: Tonight, all three futures are lower at 12:49 AM EST with ES down 0.29%. Like the Dow and the SPX, on Wednesday ES smashed right through its 200-day MA in this case at 2049 to finish at 2072 on a tall green candle. That leaves all of the indicators rising towards overbought, but they're not there yet. With Monday's green spinning top confirmed and no real resistance between here and 2090, there is technically nothing bearish about this chart tonight. The only worry is that after such a big three day gain, investors might want to be taking some profits off the table on Thursday, and the overnight pin action seems to be supporting that idea. Oh - something else to note - it looks to me like ES is putting in a double bottom with support at 2007, a bullish sign for sure. Just take a look at the daily chart here and see if you don't agree.
ES daily pivot: Tonight the ES daily pivot rises again from 2039.50 to 2063.00. Even at that, ES is still above its new pivot so this indicator continues bullish.
Dollar index: For all the hoopla on Wednesday, it wasn't particularly reflected in the dollar which lost 0.41%, a move that in other times might have seemed large but given the giant decline we saw just two weeks ago, it was nothing out of the ordinary. This fat red spinning top in bearish harami position sent the indicators moving lower before ever reaching overbought. That makes it questionable whether the dollar can advance any further on Thursday.
Euro: And on Wednesday, the euro which had been frustrated for a week now by its own 200 day MA at 1.1038 finally gave up the ghost with a gap-down red marubozu that took it back to 1.0889. That also sent all the indicator is falling off of overbought and left the stochastic in full on bearish crossover mode. And that leaves nothing at all bullish about this chart for Thursday.
Transportation: And finally the trans also had a great day on Wednesday with a 1.8% gain on a tall green marubozu. That confirms Monday's hammer and sent all of the indicators rising off of oversold. We are now also just on the edge of a three week long descending RTC for a bullish set up. It very well looks like the three week-long descending RTC might finally be over. In any case tonight, there's nothing at all bearish about this chart for Thursday.

Surely I can't be the only person who was surprised at the extent of the rally the last two days. I think this may tempt traders to take some profits, and some may develop a case of Fed remorse. Either way, although the charts are uniformly bullish tonight, the futures are guiding lower and we may be in for a pause or a bit of retracement on Thursday so I'm going to make a conditional call: if ES can stay above its new pivot by mid-morning, we'll close Thursday higher, but if it breaks under and stays there, we close lower.
Single Stock Trader
On Wednesday, Verizon was one of the better performers in the Dow and that was good enough for a better than 2% pop. That move took it above its upper BB on a tall green candle for a new rising RTC. Indicators are now all solidly rising along with a nicely completed bullish stochastic crossover. Since we are still nowhere near overbought, there might still be some more upside available on Thursday but this bus has now left the station, so it is sadly no longer a swing trade buy.
