Summary: Take the US tech bubble of the 1990s, add the subsequent real estate bubble of the 2000s, multiply by two, and you have a good approximation of the events leading to Japan's stock market crash in 1990.
The Nikkei stock index rose more than 900% in the 15 years before it finally topped. It was a frenzy powered by a belief that Japan Inc. was on its way to taking over nearly every major industry worldwide. The stock market bubble was further fueled by a massive real estate bubble at least twice the size of the one the US experienced in the 2000s. Tokyo alone became more valuable than all the land in the US.
In short, it was the product of a tsunami of monumental and concurrent events that are unlike anything present in the US today.
Long advances in the stock market bring out fears that the rise will end in a crash. A current meme is how the US market today is just like the one leading up to the 1987 crash. That same argument was made in 2013, 2014 and 2016, and failed each time.
Today's stock market is sometimes compared to Japan's main stock index, the Nikkei, in the years leading up to its brutal crash in 1990.
Some might recall the Nikkei's spectacular advance. The index rose 30% in 1989 alone, but this came after a long bull market. Over the last 5 years of that bull market, the Nikkei rose 3.4 times; over the last 15 years, it rose more than 10 times. The rise was relentless.
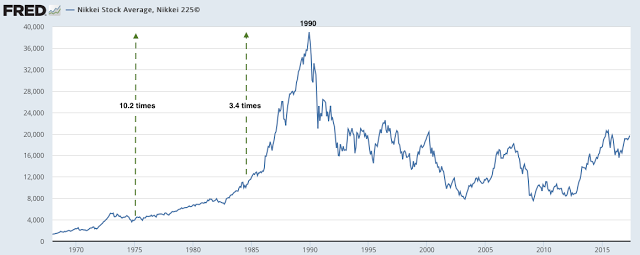
The long, sustained, uncorrected and ultimately parabolic move in the Nikkei is almost without parallel. The appreciation of the US stock indices leading up to today are nothing like it. The S&P's appreciation over the past 10 years is 1/4th that of the Nikkei into its peak. (The Nikkei comprises the 225 largest companies in Japan; the S&P 500 is the closest comparable index in the US).

But the Nikkei's epic rise is not completely without parallel. Into its peak in 2000, the Nasdaq Composite crushed even the Nikkei's rise a decade earlier. The S&P's rise was not quite as spectacular, but it was stunning nonetheless.


So, if you are looking for a parallel to Japan's Nikkei in the 1980s, the US in the 1990s ahead of the tech bubble crash is very good. The current bull market is not.
Spectacular stock gains lead to an investing frenzy and bubble that ultimately bursts. In the US in the 1990s, teachers and policemen left their jobs to become day traders. IPOs gained 300-500% on the first day of trading (more on the US's 1990s euphoria here).
The same retail investor euphoria that gripped the US in the 1990s had similarly gripped Japanese investors a decade earlier. Real incomes had more than doubled in just 20 years. By the late 80s, Japan had suddenly become one of the richest countries in the world.
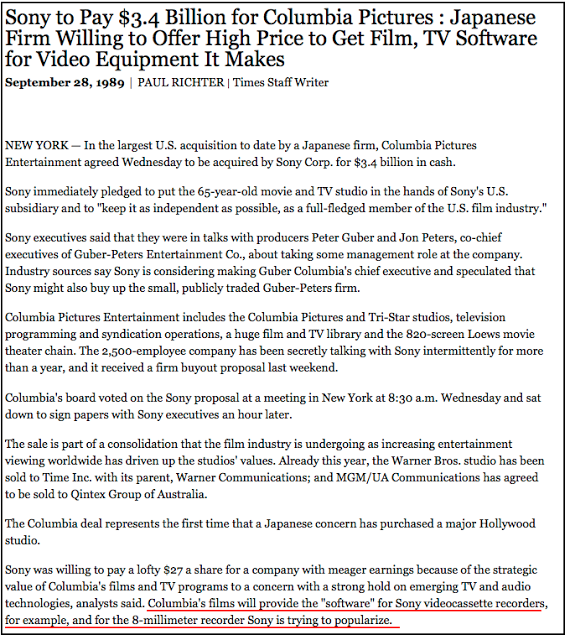
Japanese investors splashed out across the world. Sony bought into Hollywood with the acquisition of Columbia Pictures in 1989. In the same year, Mitsubishi bought Rockefeller Center in New York. A year later, a Japanese consortium bought all four golf courses in Pebble Beach.
Japanese investors started buying art at unheard sums. In 1987, a Japanese company bought Van Gogh's Sunflower painting for nearly $40 million.
The US in 1990s was similar to Japan in the 1970s and 80s in fundamental ways, too. Today's investors think of Japan mostly as a cautionary tale: an economy that is stagnant and deflationary, with monetary and fiscal leadership that is ineffectual. But during Japan's stock market bonanza, it's industries basked in the same boundless optimism as US technology companies a decade later.
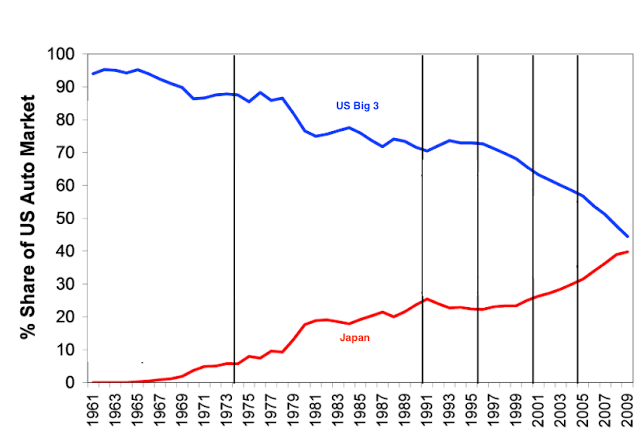
Manufacturing was the heart of the US economy through the 1960s, and automobiles symbolized American industrial might better than no other. But within a 20 year period, Japanese automakers took nearly 30% of the US market. By 1990, a full 60% of the US trade deficit was due to Japanese net imports alone.
These changes were reflected in popular culture. In 1986, required reading for anyone in business was David Halberstam's best-seller, The Reckoning, detailing the story behind the seemingly unstoppable rise of Nissan and demise of Ford.
In the same year, Ron Howard and Michael Keaton made a hit movie, Gung Ho, about a company foisting its Japanese management techniques on a US auto manufacturer. Yes, people went to the movies to see why Japan was so good at what they did.
It wasn't just that Japanese companies were beating the US in manufacturing (somewhat akin to China and other parts of Asia today). Their designs and brands were also superior. Perhaps the most desirable brand in the world belonged to Sony, which had innovated into new businesses (the Walkman) and dominated existing ones (televisions) in a way that is reminiscent of Apple (NASDAQ:AAPL) today.
Apple sold 22 million iPods in 2009, the product's peak year. By 1991, 100 million Walkmans had been sold.
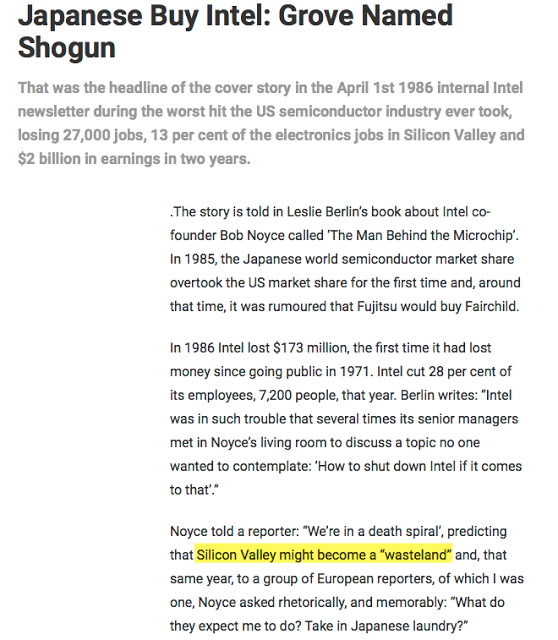
In 1986, Japan overtook the US in worldwide semiconductor sales. Fujitsu Ltd. (T:6702) was rumored to be buying Fairchild. IBM (NYSE:IBM) might be next. Intel (NASDAQ:INTC), one of the bedrock companies of Silicon Valley, was forced to cut 28% of its workforce, the future of its very existence was in serious doubt.
US companies studied the Japanese business model the way Microsoft (NASDAQ:MSFT) and Cisco Systems Inc (NASDAQ:CSCO) were studied in the late 1990s. Kenichi Ohmae, the head of McKinsey in Japan, became an internationally renowned guru and best-selling author, advising clients and readers on successful Japanese management practices.
So, the investor euphoria and business hegemony of Japan ahead of it's stock market crash were very similar to the US in the 1990s. But there was a major, additional difference.
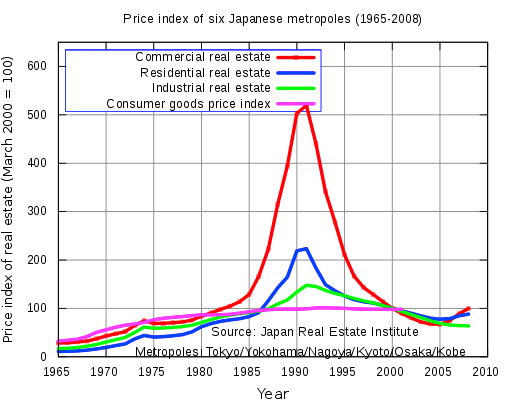
The capital Japan amassed through its industrial successes was plowed into domestic real estate. In the 1980s, commercial real estate prices in the six largest metropolises rose 4 times. It was said that all the land in Japan was worth more than 4 times the entire United States, a country that is 25 times larger. The land in Tokyo alone was more valuable than all the land in the US. The Imperial palace grounds in Tokyo were said to be worth more than all of California.
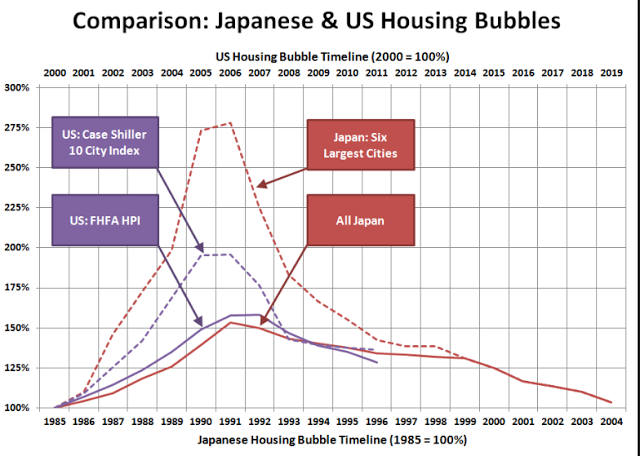
The US housing bubble that subsequently fed the 2008 financial crisis was led by a 100% increase in housing prices. The Japanese housing bubble was 2 times larger.
Similar to the US a decade ago, the Japanese real estate bubble inflated the shares on its stock exchange: the rise in the Nikkei traces the rise in real estate.
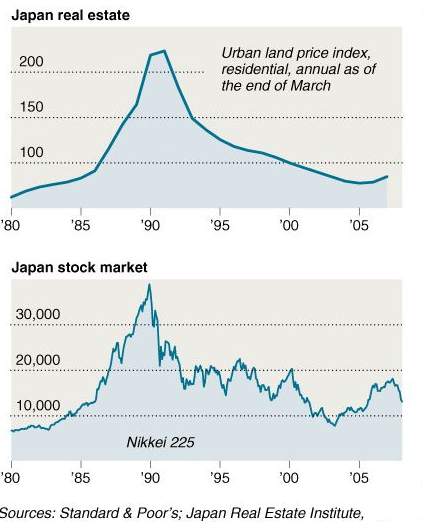
In late December 1989, the Bank of Japan (its central bank) belatedly reacted to asset price inflation by raising the discount rate from 2.5% to 4.25% and then to 6% in 1990. The Nikkei dropped 50% in one year. Real estate prices halved over the next 4 years. The bubble had burst.
The drop in asset prices became a spiral as investor confidence was shattered. In 1993, a colleague compared the mindset of the Japanese investor to a person afraid to step off the sidewalk because they had been run over the last three times they had tried.
The Nikkei stock index rose more than 900% in the 15 years before it crashed. That stock frenzy was driven by investor euphoria much like the one the US experienced in the 1990s, powered by a belief that Japan Inc. was on the way to taking over nearly every major industry worldwide. And the stock bubble was further fueled by a massive real estate bubble twice the size of the one the US experienced in the 2000s. In short, it was the product of a tsunami of monumental and concurrent events.
So, take the US tech bubble and the subsequent real estate bubble (multiplied by two) and you have a good approximation of the events leading to Japan's stock market crash in 1990. This makes the experience of the stock indices in Japan during that era unlike the US today.
If you find this post to be valuable, consider visiting a few of our sponsors who have offers that might be relevant to you.


