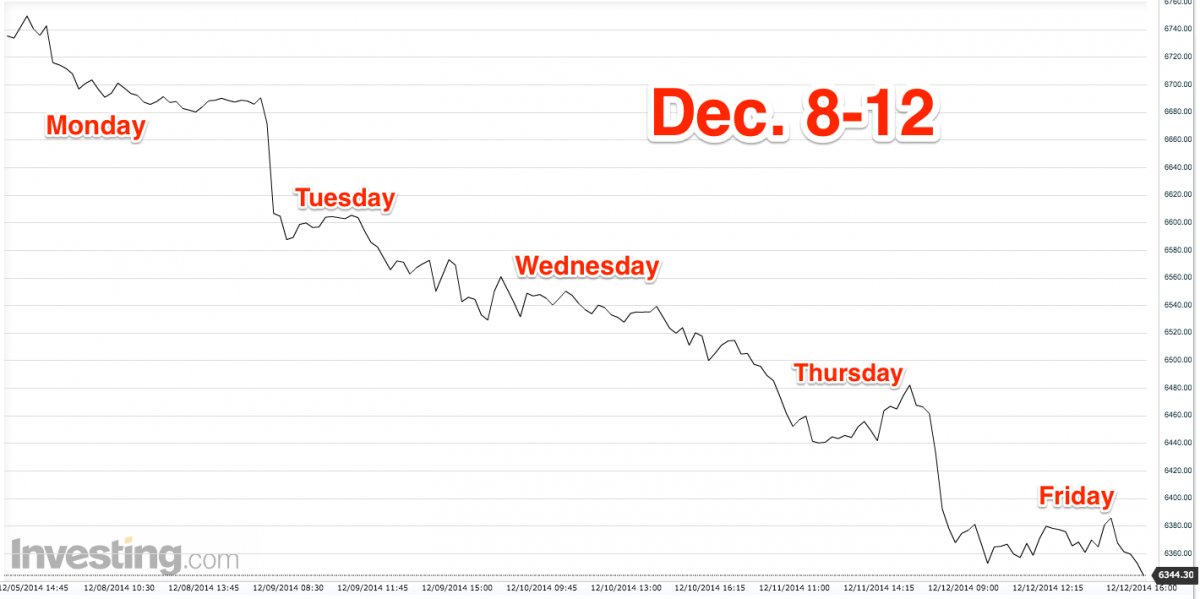
Sometimes a dominant story continues from one week to the next. Crashing energy prices and continued selling of any related stock seems to have spilled over into the rest of the market. There will also be a Fed meeting with new projections and a press conference.
Will crashing energy prices change the Fed’s course?
Prior Theme Recap
In my last WTWA I predicted plenty of discussion about a Santa Claus rally. It was indeed a popular subject, including some of those new live polls of TV viewers, but the story faded late in the week. It is a good thing I put a question mark in the title!
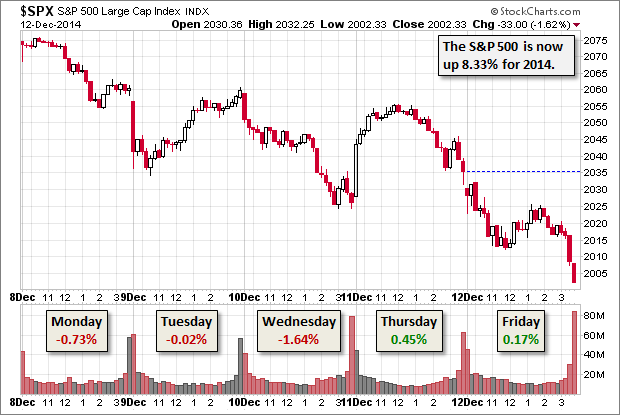
Here is Doug Short’s weekly snapshot of the S&P 500 (with plenty of additional interesting charts in the post).
Feel free to join in my exercise in thinking about the upcoming theme. We would all like to know the direction of the market in advance. Good luck with that! Second best is planning what to look for and how to react. That is the purpose of considering possible themes for the week ahead.
This Week’s Theme
The decline in oil prices has been swift and sharp. Last week the selling clearly spilled over into other sectors, grabbing the attention of everyone. This relationship is the subject of considerable debate. It is happening on the verge of the FMOC meeting. Since the Fed remains a focal point for market analysts, I expect these two themes to converge:
Will crashing energy prices change the Fed’s course?
The combination of the two requires analysis of each.
What does the oil price decline tell us about the economy (and therefore the stock market)? Here are the contending viewpoints:
- Oil prices are a good economic indicator.
- Declining prices imply a serious decline in the global economy (Mainstream media – typical example)
- This decline may drag down the US economy as well (perhaps via junk bonds- extensive analysis from Yves Smith) (earnings analysis from Brian Gilmartin)
- Other stock sectors will trade in sync with energy (investment spending cutbacks could ripple- Oil and Energy Insider)
- Oil prices have a complex and varying relationship with other economic indicators
- Declining oil prices have a mostly positive effect on the economy (Dr. Ed on the IMF upgrade of the US)
- Prices often move in a coincident rather than a leading fashion
- In 2008, high prices helped to create the recession, so oil was a contrary indicator
- In 2011, high prices reflected (inaccurate) QE speculation about inflation. The subsequent decline gave a false signal on the economy.
What will the Fed do as a result? Once again, we have dueling arguments:
- The Fed is poised to do another round of QE
- A deflationary threat will spark a dovish shift in policy
- The Fed acts to protect stock prices
- The Fed will react more to economic data
- This means eliminating the “extended time” before the first rate hike language, perhaps with a weaker substitute
- There may be more hawkish dissents
- The Fed will keep current policy and language, reacting to the lower risk of inflation
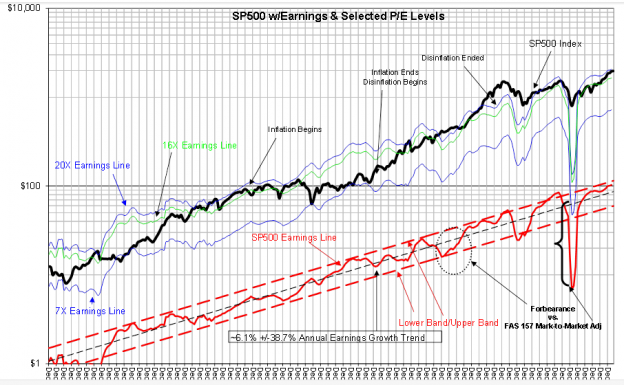
At the risk of oversimplifying, the “trader” community emphasizes the signal from oil prices. Bespoke has good analysis with plenty of charts. Here is a key quote and one example:
The drop in oil is finally getting noticed by the market. Shocks to the system like this are not met with enthusiasm by investors, regardless of whether or not falling oil prices may ultimately be good for the economy. For now, it looks like oil is going to need to stabilize for the market to remain in rally mode.
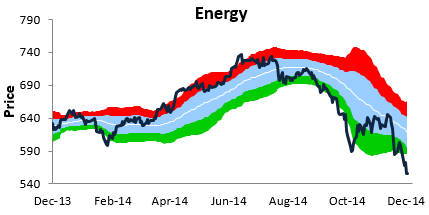
The “economist” community, including economists at major street firms, emphasizes economic data.
Tim Duy is the leading Fed watcher. He believes that economic data support the Fed plan already telegraphed. Read the full article for plenty of supporting argument, data, and charts.
The “investment” community takes a long-term, data-based viewpoint.
Josh Brown is a vocal representative for this group, and argued forcefully both on TV and on his blog – They’re all making it up. In a refreshing look at actual data, he notes that oil prices frequently show a negative correlation with stocks. His conclusion:
They’re watching market prices fluctuate and assigning meaning where none exists. Stories are being told and headlines are being crafted so that there is something for you to click on from your app when you check the news. This is nothing to be mad about, it is what it is. But the sooner you learn this lesson, the savvier a consumer of financial news you will be.
Daily market reports – collections of statistics woven together with quotations from whichever experts answered their phones – are inferior to raw data and charts. They’re giving you an ex-post description of the beliefs of your fellow guessers who are no better at explaining day-to-day randomness than you are.
I read that book and you should, too. You will both enjoy and learn.
I have some strong opinions on this question, with implications for investments. More about that in today’s conclusion. But first, let us do our regular update of the last week’s news and data. Readers, especially those new to this series, will benefit from reading the background information.
Last Week’s Data
Each week I break down events into good and bad. Often there is “ugly” and on rare occasions something really good. My working definition of “good” has two components:
- The news is market-friendly. Our personal policy preferences are not relevant for this test. And especially – no politics.
- It is better than expectations.
The Good
The news last week was very good, once again positive, despite the market reaction.
- Hotel occupancy is stronger. The rate is up over 3% year-over-year, to a current level of 57.1% Calculated Risk has the story on yet another non-government data source showing economic strength.
- Consumer confidence hit another new high – almost 94. This is a good proxy for spending, employment and stock prices.
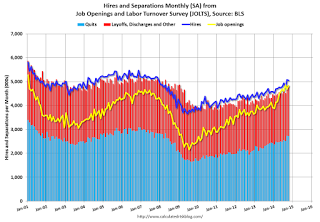
- Job openings show strength. The JOLTS report does not get enough respect. I was an early follower and recommended the quit rate as the best takeaway. See this post from 2009. This indicator has finally arrived, since it was featured by USA Today! There is finally some understanding that voluntary separations indicate confidence and labor market strength. How many people realize that 2.8 million people voluntarily quit their jobs in September? That is the point of this report – not an inferior, back-door method for estimating net job growth. Here is an authoritative story from Calculated Risk – job openings up 21% year-over-year.
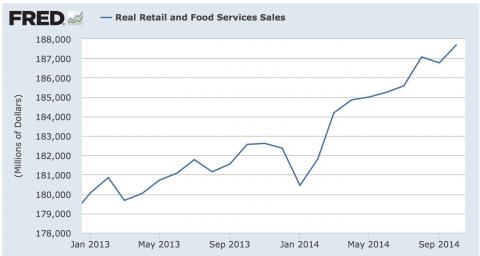
- Retail sales showed strong growth – up 0.7% month-over-month and 0.9% without gasoline. (Remember that many chose to dismiss strong retail sales in some prior months since it reflected only gas prices. Let us be fair in analyzing this). New Deal Democrat sees this as solid evidence of improvement for the consumer, citing the chart below. (Doug Short is more skeptical, noting the big revisions in this series).
The Bad
Once again, the bad news was less significant than the reaction in stocks. Readers are invited to nominate ideas in the comments, but remember that we are focusing on recent developments, not a list of continuing macro concerns. Art Cashin had (yet another) good quip this week about people who had a cup of coffee and “suddenly noticed” something. I share his skepticism about delayed reactions.
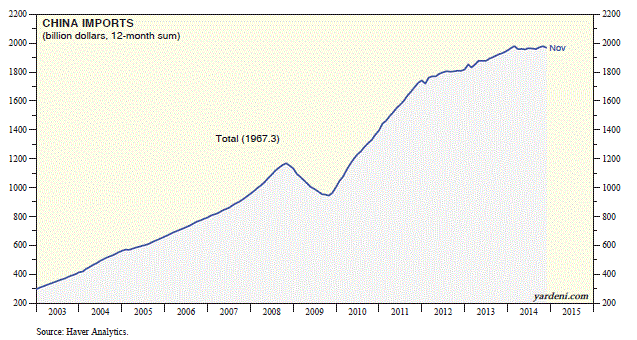
- Chinese economic news disappointed. Rules for investing were changed to eliminate low-grade corporate bonds as a source of collateral. Some likened this to a US increase in the margin requirement. There was an immediate 5% hit to the high-flying Shanghai Composite. Did you know that the Chinese have a 35% savings rate? Dr. Ed has the story, and this chart showing the slowing Chinese imports:
- Europe. For those who believe in spillover effects, the European story was very negative. There was negative news from both Greece and France.
The Ugly
Stocks – the worst week in four years.
Congress is on probation. Temporary action seems to have averted a government shutdown, but only for a few days. (Politico and The Hill on the House compromise). It appears that a final resolution will be reached in the Senate by Wednesday, but it remains a worry. Some attributed part of Thursday’s late-day selling to the failure of a compromise bill. (Politico) I continue to watch closely.
The Silver Bullet
I occasionally give the Silver Bullet award to someone who takes up an unpopular or thankless cause, doing the real work to demonstrate the facts. Think of The Lone Ranger. No award this week. Nominations welcome.
Quant Corner
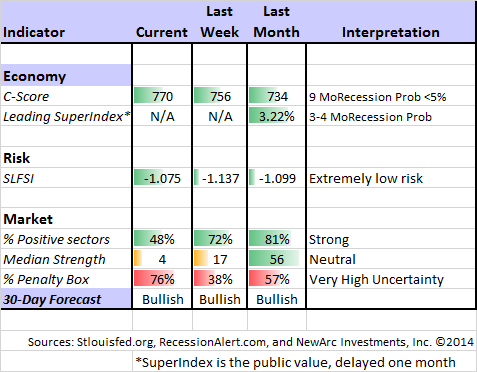
Whether a trader or an investor, you need to understand risk. I monitor many quantitative reports and highlight the best methods in this weekly update. For more information on each source, check here.
Recent Expert Commentary on Recession Odds and Market Trends
Georg Vrba: has developed an array of interesting systems. Check out his site for the full story. We especially like his unemployment rate recession indicator, confirming that there is no recession signal. Georg’s BCI index also shows no recession in sight. Georg continues to develop new tools for market analysis and timing. Some investors will be interested in his recommendations for dynamic asset allocation of Vanguard funds. Georg has a new method for TIAA-CREF asset allocation. I am following his results and methods with great interest.
Bob Dieli does a monthly update (subscription required) after the employment report and also a monthly overview analysis. He follows many concurrent indicators to supplement our featured “C Score.”
RecessionAlert: A variety of strong quantitative indicators for both economic and market analysis. While we feature the recession analysis, Dwaine also has a number of interesting market indicators.
Doug Short: An update of the regular ECRI analysis with a good history, commentary, detailed analysis and charts. If you are still listening to the ECRI (three years after their recession call), you should be reading this carefully.
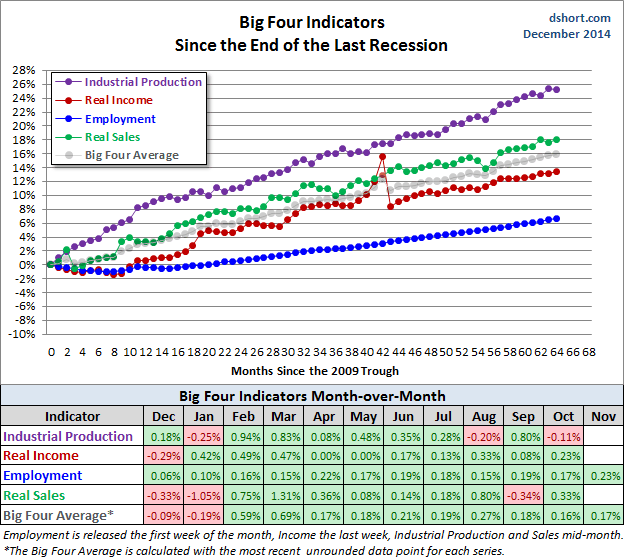
It is time for another update to Doug’s Big Four – the indicators most important to the official recession-dating process.
Healthy skepticism on seasonality comes from Statistical Ideas (A special HT to Abnormal Returns). A better look at Santa and also years ending in “5? Really?
The Week Ahead
There is a normal data schedule this week, with emphasis on the Fed meeting.
The “A List” includes the following:
- FOMC decision (W). Announcement, dot plots, press conference and more.
- Initial jobless claims (Th). The best concurrent news on employment trends, with emphasis on job losses.
- Housing starts and building permits (T). I emphasize permits as a good leading indicator for housing.
- Leading indicators (F). Will the recent strength continue?
The “B List” includes the following:
- CPI (W). Not yet a major concern, but still watched carefully.
- Industrial production and capacity utilization (M). A rebound in this volatile series?
- Crude oil inventories (W). For the moment at least, this announcement is getting plenty of attention.
I do not care much about the Empire Index or the Philly Fed, which had an amazing reading of 40.8 last month. Everyone was skeptical of the data, so the reaction this week should be interesting. FedSpeak is on hold before the meeting. Richmond President Lacker is scheduled for Friday, which could be interesting. So is IMF chief Lagarde.
How to Use the Weekly Data Updates
In the WTWA series I try to share what I am thinking as I prepare for the coming week. I write each post as if I were speaking directly to one of my clients. Each client is different, so I have five different programs ranging from very conservative bond ladders to very aggressive trading programs. It is not a “one size fits all” approach.
To get the maximum benefit from my updates you need to have a self-assessment of your objectives. Are you most interested in preserving wealth? Or like most of us, do you still need to create wealth? How much risk is right for your temperament and circumstances?
My weekly insights often suggest a different course of action depending upon your objectives and time frames. They also accurately describe what I am doing in the programs I manage.
Insight for Traders
Felix continued the profitable bullish posture for another week. There is still reasonable breadth among the strongest sectors, although the ratings continue to decline. The overall average strength is now neutral, so this week’s “bullish” call is a close one. Felix does not anticipate tops and bottoms, but responds pretty quickly when there is evidence of a change. The penalty box can be triggered by extremely high volatility and volume. It is similar to a trading stop, but not based only on price. There has been quite a bit of shifting at the top, so we have done some trading.
Dana Lyons has a short term indicator that has never failed! (So far). The pop in VIX is bullish for the year-end.
Andrew Thrasher warns that being “overbought or oversold” is often not enough. Traders should check out his charts.
You can sign up for Felix’s weekly ratings updates via email to etf at newarc dot com.
Insight for Investors
I review the themes here each week and refresh when needed. For investors, as we would expect, the key ideas may stay on the list longer than the updates for traders. Major market declines occur after business cycle peaks, sparked by severely declining earnings. Our methods are directed at spotting these major declines. A key element is staying focused on data rather than noise. I took a closer look at the most recent scary themes in Keeping Investors Scared Witless. If you missed it, please take a look.
Last week I also offered Some Crucial Facts about Energy, providing some perspective on the oil price decline and associated opportunities.
Other Advice
Here is our collection of great investor advice for this week:
Market Sentiment
Mark Hulbert suggests that stocks are “not even close” to topping out. The main thesis is that sentiment is far different from what is usually seen at market tops.
The Fat Pitch has a different take, citing data both from individual investors and the opinions of Barron’s Wall Street Strategists.
Stock Ideas
Scott Grannis likes junk bonds, based upon current swap spreads. I recommend buying with care if you are looking at individual bonds in the energy sector.
The opportunities and risks of MLP’s. All About Alpha has a comprehensive analysis of risks and rewards.
Growth stock suggestions from Barron’s – including one in energy.
Ray Merola has some “energy gems among the rubble.”
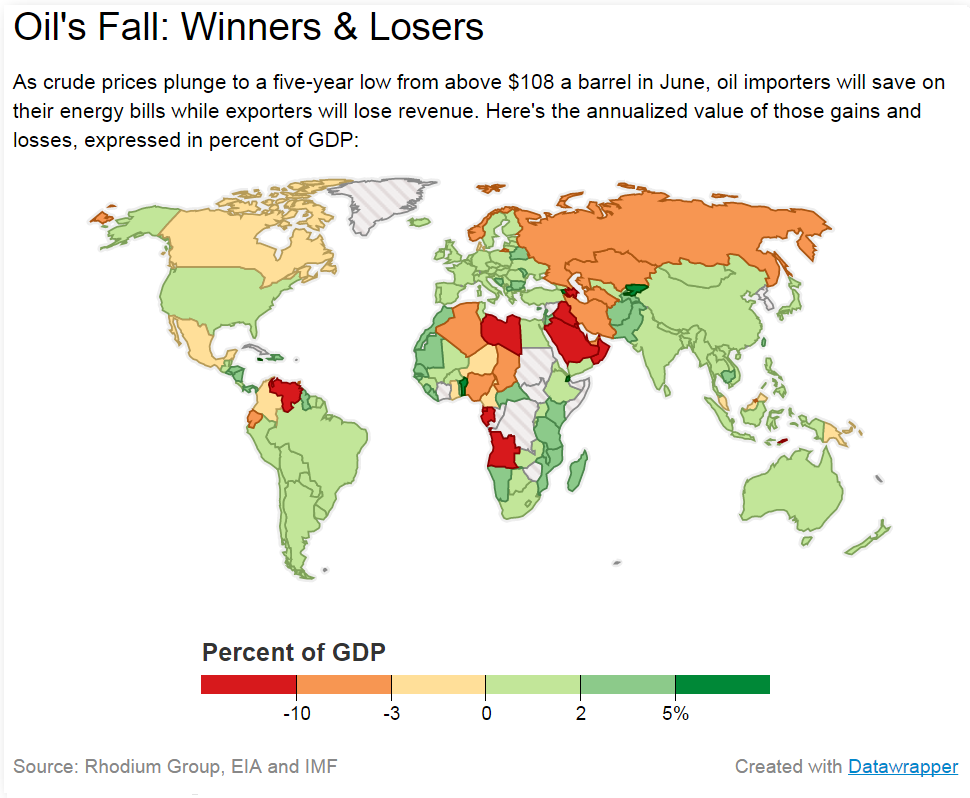
Countries that are winners and losers from oil price declines:
Scams
Scams are always tempting when dissatisfaction and fear about regular investments are high.
Would you lend money to this guy? Bill McBride explains the risk in the Lending Club business. He also provides a lot of good commentary on personal finance.
Affinity appeals may be Ponzi schemes. Clark Howard provides some warning signs:
Ask yourself this: If they’re really making those great returns they promise, why do they need me? They should have more than enough money on their own. The answer is that they don’t need you, it’s just a ruse.
Market Outlook
If you read only two of my investment links this week….
One should be this post from “Davidson” (via Todd Sullivan). It is chock-full of key advice for investors, and it is also very timely. He has a list of key points and some good charts. Here are my favorites:
Why most investors do not see the longer term relationships is based on the desire for quick riches in my opinion. Once someone sees that markets react to some news worthy event, the perception that psychology and markets are strongly connected becomes imbedded quickly into investor thinking. Most do not move beyond these short term perceptions because they are investing for quick shifts in market prices and as a consequence spend considerable time, money and effort trying to predict them. ‘Short-termism’ is what causes most investors to miss the broader economic connections to security prices.*
*(I taught investments at one of the nations recognized universities. The accepted mathematical approach in the globally accredited syllabus, which is deemed ‘scientific’, completely ignores economic fundamentals.)
Another should be Morgan Housel’s List of 122 Things Everyone Should Know about Investing. These are all so good that it is tough to pick favorites. Here are some of mine:
Saying “I’ll be greedy when others are fearful” is easier than actually doing it.
There is a difference between, “He predicted the crash of 2008,” and “He predicted crashes, one of which happened to occur in 2008.” It’s important to know the difference when praising investors.
Wealth is relative. As comedian Chris Rock said, “If Bill Gates woke up with Oprah’s money he’d jump out the window.”
(BTW, Mr. Gates had another fine performance at the most recent North American Bridge Championship—27th in a very strong field).
Final Thought
Readers will not be surprised that my take on energy is more closely aligned with economists and investment managers than with traders. It is not any bias against traders. I like and understand them, and appreciate their skills. It is a matter of time frames.
When you are forced to predict what will happen next week (or tomorrow or in the next few minutes), you look for correlations in recent data. You embrace simple heuristics like “Risk on, risk off.” If something quits working, you look for a new theme.
Investors should take a long-term viewpoint. Trying to time the market is one of the key things I warn against in my Tips for Individual Investors. Everyone would love to be a genius, and it looks so easy after the fact. I am going to repeat some of my conclusion from last week.
I avoid making short-term market forecasts, leaving that to Felix!
I also generally eschew the “seasonal” forecasts. The underlying rationale is often weak and/or not applicable. The end of the Presidential cycle, for example is supposed to reflect efforts to support the party in the next election. The current situation – Obama legacy at stake, GOP Congress, possible compromises – do not really fit that pattern. Years ending in “5” seems like data mining.
I prefer to ignore the calendar and follow a process of constantly upgrading price targets on individual holdings. This is consistent with a key precept:
Do not follow the market. Instead take advantage of what the market is giving you.
To do this you need a method for finding underpriced stocks and confidence to stick to your methods, even when the market disagrees. If you think the markets are efficient, you should just buy index funds.
Most people lack confidence and therefore drift from theme to theme, chasing what worked last month or last year. They have a fixation on what they read in the financial news, forgetting that their business model is selling advertising and yours is making money.
My conclusions on the key questions for this week?
- Economic data are more reliable than the “commodity indicator.”
- The correlation between energy stocks and the rest of the market seems impressive on a daily basis since it fits the heuristics of traders and HFT models. There are periodic meetings of pension fund investment committees and other managers of really big money. Eventually value based upon earnings is reflected. Markets are eventually efficient, but do not count on it every day.
- The Fed focuses on data, not commodity prices. The economic growth target seems to be moving, mostly because there is no evidence of inflation. The Fed may be mistaken about this, but the message is pretty clear. I expect accommodative policy for the foreseeable future. (See the great chart from Barry Ritholtz and note the difference between voting and non-voting FOMC members).
The investment conclusion is opportunity in non-energy cyclical stocks, including basic materials, technology, and consumer discretionary. There are also energy names that are part of the knee-jerk reaction, but which do not necessarily suffer from lower oil prices. These include refiners and some of the large integrated oil companies that need to replace reserves. (Barron’s also suggests oil tanker stocks – storage needed!)
And by the way – If you were in charge of China’s (or India’s) energy future, what would you be doing?

