With the S&P 500 and Dow Jones Industrial Average already hitting real, inflation-adjusted, all-time highs; market participants have now turned their attention toward the NASDAQ Composite. Today's "Chart of the Day" takes a look at just how close, and far, the Nasdaq is from joining the "all-time"-high club.
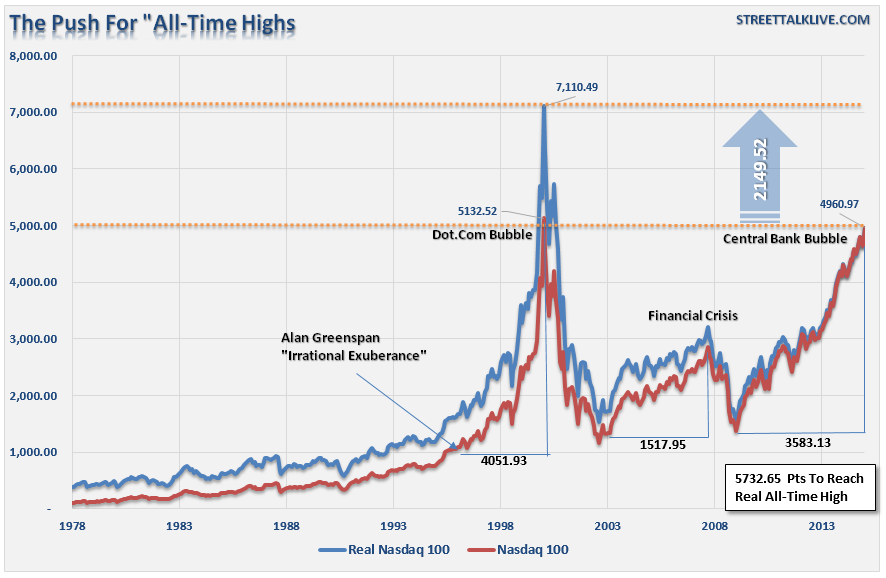
The chart below shows the Nasdaq Composite index in both nominal and inflation-adjusted terms using the CPI index as the proxy for the inflation adjustment.
As shown, the nominal peak of the Nasdaq Composite occurred in early 2000 at 5132.52. As of Monday's close of 4960.97, the Nasdaq sits within striking distance of that nominal high.
However, in order for the Nasdaq to enter into the "real all-time-high club" it would currently require an additional gain of 2149.52 points or an additional 43.3% gain from current levels. While that seems like a rather lofty goal, it would only require the top 20 stocks in the composite index to just a little more than double in value from current levels.
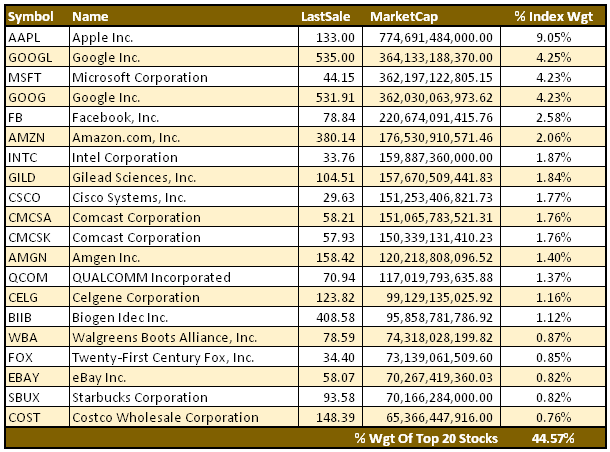
The table below shows the top 20 stocks in the Nasdaq composite by market capitalization. Interesting note: the top 20 stocks comprise 44.57% of the total market capitalization of an index that contains 2,962 companies (via Nasdaq.com).
From the time that Alan Greenspan first uttered the words "irrational exuberance" in 1996, the Nasdaq Composite surged by 4051.93 points to its intraday peak of 5132.52 in March of 2000. That was just shy of 4-years later.
Following the "dot.com" bubble reversion, the Nasdaq then rose over the next 4 years and 7 months to its peak in November of 2007 -- rising just 1517.95 points. As the financial crisis set in, the Nasdaq retraced back to near its previous lows.
Then, as Congress and the Federal Reserve leapt into action and began to flood the financial system with liquidity through bailouts, fiscal policies and direct liquidity interventions, the Nasdaq started its latest run. To date, that rise has encompassed 3583.13 points. However, in order for the Nasdaq composite to reach inflation-adjusted "all-time" highs it would currently require a total increase of 5732.65 points or more than the total gain of the Nasdaq composite from inception of the index to its peak in March of 2000.
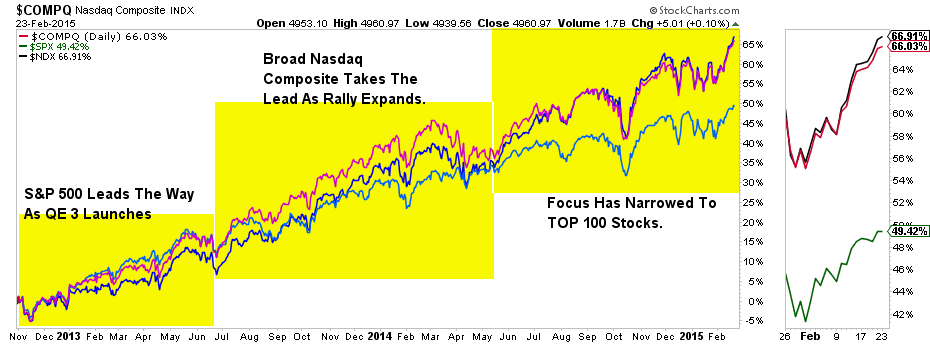
The focus of participation in the markets has narrowed significantly in recent months. The chart below shows the rally that began with the onset of the Fed's last round of QE in December of 2012. During the first phase of the rally, the S&P 500 led the performance charge as money chased dividend yields and lower perceived risk. However, as the rally gained traction, the focus of investors turned from safety to risk and the broad Nasdaq composite took the lead.
Then, as the Fed began to bring QE to an end, the focus narrowed to the top 100 stocks in the Nasdaq, which has maintained a performance lead over the more conservatively perceived S&P 500. (Note: Since the top 20 stocks in the Nasdaq make up 44.5% of the total Nasdaq composite index, the narrow margin between the two indices is expected.)
In the current market environment, particularly where Central Bank interventions have effectively removed all perceived "risk" from the markets, my suspicion is that the drive to attain nominal new highs in the Nasdaq will be achieved in fairly short order. However, I am doubtful that the Nasdaq will be able to make the push to real "all-time" highs without a significant correction first. It will eventually happen; it is just unlikely to happen within the current cycle. But then again, in a market that seems detached from fundamental underpinnings - "anything is certainly possible."
While there are many that suggest there is "no bubble" in the financial markets at the current time, a simple look at the extreme elevation of prices over the last couple of years is eerily reminiscent of the late 90's. Given the very elevated levels of investor bullishness, margin debt and complacency, there is more than sufficient evidence that a mean reverting event is highly likely at some point.
However, at the moment, the perceived "risk" by investors is "missing the run" rather than the potential destruction of capital if something goes wrong. This is the opposite of what "risk" management and effective "risk" controls are about in portfolio management. While this is always the case in late stage bull-markets as exuberance overtakes logic, it is also why investors are damaged so badly during the ensuing mean reversion process.
It is always important to remember that for every bull market there will eventually be a bear. It is the nature of the markets and the reality of full-market cycles.


